Download
1 / 1
10 likes | 146 Vues
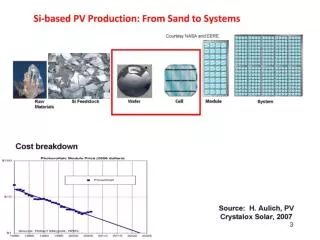
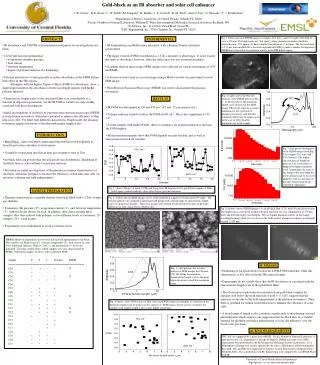
Gold-black as an IR absorber and solar cell enhancer J. W. Cleary 1 , R. E. Peale 1 , C. W. Smith 1 , M. Ishigami 1 , K. Baillie 1 , J. E. Colwell 1 , K. M. Beck 2 , Alan G. Joly 2 , O. Edwards 3 , C. J. Fredricksen 4 1 Department of Physics, University of Central Florida, Orlando FL 32816

E N D
Gold-black as an IR absorber and solar cell enhancer J. W. Cleary1, R. E. Peale1, C. W. Smith1, M. Ishigami1, K. Baillie1, J. E. Colwell1, K. M. Beck2, Alan G. Joly2, O. Edwards3, C. J. Fredricksen4 1Department of Physics, University of Central Florida, Orlando FL 32816 2Pacific Northwest National Laboratory, William R. Wiley Environmental Molecular Science Laboratory, Richland, WA 3Zyberwear, Inc., 2114 New Victor Road, Ocoee FL 4LRC Engineering, Inc., 9345 Chandon Dr., Orlando FL 32825 Fig. 5 (below) presents PEEM images of samples C01 (left), and C13 (right) with field of view = 150 mm. The bright areas are “hot spots”, where plasmon resonances facilitate photoemission. C01 appears to have a higher concentration of hotspots. The lower left part of C13 has been modified by a focused ion-beam mill (FIB) to make a marker for alignment. PEEM shows that it has less plasmon activity in the FIB milled region. ABSTRACT EXPERIMENTAL • IR absorbance and VIS/NIR excited plasmon resonances are investigated in Au-black. • 2 level full factorial optimization • evaporation-chamber pressure • boat current • substrate temperature • degree of polymer infusion (for hardening) • Polymer infusion was found generally to reduce absorbance in the LWIR but has little effect in the THz region. • Samples with the highest Figure of Merit (FOM) for absorbance show a slight improvement in the absorbance in both wavelength regimes with higher polymer infusion. • Characteristic length scales of the structured films vary considerably as a function of deposition parameters, but the IR FOM is found to be only weakly correlated with these distributions. • Initial investigations of Au-black by photoelectron emission microscopy (PEEM) reveal plasmon resonances, which have potential to enhance the efficiency of thin film solar cells. For films with different characteristic length scales, the plasmon resonances appear in portions of the film with similar length scales. • IR Transmittance and Reflectance measured with a Bomem Fourier transform spectrometer. • The figure of merit (FOM) was defined as 1-T-R, a measure of absorbance. It is not exactly the same as absorbance, however, since the reflectance was not at normal incidence. • Scanning electron microscope (SEM) images were collected on various instruments at UCF and EMSL. • A discrete wavelet analysis on each image using a Morlet wavelet was performed on each SEM image. • PhotoElectron Emission Microscopy (PEEM) was used to characterize the plasmon resonances. Fig. 6 (right) shows the Wavelet analysis of the PEEM spectra of Fig. 5. Symbols indicate the minimum length scale observed in the SEM image. This result suggests a certain minimum for the excitation of plasmon resonances, and that this minimum which may be larger (as in in the case of C01) than the minimum size in the sample. RESULTS • IR FOM was determined at 150 and 650 cm-1 (67 and 15 mm respectively ). • Polymer infusion tended to reduce the FOM at 600 cm-1. This is less significant at 150 cm-1. • For the samples with highest FOM , there is a tendency for polymer infusion to increase the FOM slightly. • Mid-point measurements show that FOM depends on each variable, and as well as interactions between all variables. INTRODUCTION • Metal-black : nano-structured conducting films that have been exploited as broad-band surface absorbers for bolometers . • Created by evaporating metal in an inert gas at tenths to tens of Torr. • Au-black films are powder-like (broad particle-size distribution). Hardening of Au-black films is achieved here via polymer infusion. • Presented are initial investigations of the plasmon resonance characteristics of Au-black, which has potential to increase the efficiency of thin film solar cells via resonant scattering and field enhancement. Fig. 7 (left) present histograms of the PEEM images from Fig. 5 for samples C01 (top) and C13 (bottom). The higher concentration of bright hot spots for C01 is revealed as a bump at the highest intensity level. In principle, the ratio of this bump to the area under the lower intensity part of the curve might be used as a measure of hot-spot density in properly controlled experiment. Fig. 1. (above) Figures of merit at THz and Long-wave IR frequencies for gold-black samples of Table I. Solid (open) symbols indicate values after (before) polymer infusion. SAMPLE PREPARATION • Thermal evaporation in a chamber that has been back-filled with 1-2 Torr of inert gas (helium). • Parameters: He pressure ( P ), evaporation current ( I ), and substrate temperature ( T ) with two levels chosen for each. In addition, after characterizing these samples, they were infused with polymer to two different levels of saturation. 20 samples (16 + 4 mid points) • Experiments were randomized to avoid systematic errors. Fig. 2 (below) present SEM images of two of the gold black samples C04 (left) and C09 (right). The metallic particles are arranged in interconnected groups with a broad-range of characteristic length scales or spatial wavelengths. These two images were chosen for presentation because of the large difference in their characteristic length scales. Fig. 8 (below) shows PEEM images of a gold black film (C13) with 50 mm field-of-view. The bright areas correspond to photoelectron emission for laser illumination at 370 nm (left) and 420 nm (right) wavelengths. We see higher plasmon activity in the longer wavelength image when we are closer to the bulk surface plasmon resonance wavelength of gold (~500 nm). Table I: Matrix of experiments in two-level full factorial optimization of Au-black. The variables are He pressure (P), substrate temperature (T), boat current (I), and level of polymer infusion. High (+), low (-), and intermediate (*) levels are indicated. The final column shows which samples were also characterized by PEEM. Underlined samples are those with exceptional FOM. Sample P T I Polymer PEEM =================================================== C01 + + - + X C03 + - - - C04 + - - + X C05 * * * * C06 - - - - C07 - + - + C08 + + - - C09 * * * * X C10 + - + + C11 + + + + C12 - + + - X C13 - + + + X C14 + - + - C15 - - - + C16 - - + + C17 - - + - C18 - + - - C19 + + + - C20 * * * * C21 * * * * SUMMARY Fig. 3 (left) presents the wavelet analysis of SEM images for C04 and C09. We define the minimum characteristic length scale as the point where the power is half the maximum value. • Hardening of Au-black tends to lower the LWIR FOM somewhat, while this characteristic is less effected in the THz spectral range. • Experiments do not clearly show that the IR absorbance is correlated with the characteristic length scale of the gold-black films. • The observation of photoelectron emission from gold-black samples for energies well below the work function of gold (~ 5.1 eV) suggests that the emission occurs due to the field enhancement at the plasmon resonances. Thus, there is potential for similar useful effects in to enhance the efficiency of solar cells. • A broad range of length scales contribute significantly to the plasmon-assisted photoemission which supports our suggestion that Au-black may be a suitable material for plasmon-resonance enhancement of solar cell efficiency over the broad solar spectrum. Fig. 4 (below) plots FOM values at THz (left) and LWIR (right) wavelengths as a function of the minimum length scale from the wavelet analysis of SEM images. There may be a tendency for samples with smaller length scales to give higher absorbance. ACKNOWLEDGEMENTS . JWC and are supported by a grant from AFOSR. Pacific Northwest National Laboratory is operated for the U.S. Department of Energy by Battelle. PEEM and some of the SEM experiments were performed in the Environmental Molecular Sciences Laboratory, a U.S. Department of Energy user facility operated by the office of Biological and Environmental Research. JEC and KB were supported by NASA's Cassini Data Analysis Program Grant NNX08AJ68G. The contributions of LRC Engineering were supported by an AFOSR Phase I STTR. University of Central Florida Physics Department: http://physics.cos.ucf.edu/content/index.html