Download
1 / 19
190 likes | 297 Vues
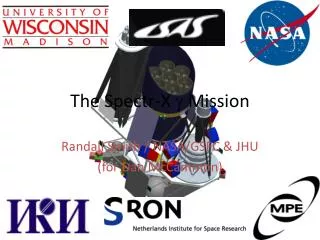
The Spectr-X g Mission. Randall Smith / NASA/GSFC & JHU (for Dan McCammon).

E N D
The Spectr-X g Mission Randall Smith / NASA/GSFC & JHU (for Dan McCammon) Typical 5° x 5° field from the 4-year all sky survey. The simulation is for a multi-component fit to Suzaku observations near the North Ecliptic Pole. The lower panel shows the result using filters similar to the new sounding rocket filters. The upper panel shows the same observation assuming filters identical to those used for the XRS instrument on Suzaku. Note that there is almost no information about the ubiquitous 1x10⁶ K component.
ART eROSITA SXC Lobster (?)
Just the Facts • Launch (on Russia rocket) in 2011 • Primary instrument: eROSITA (MPE) • 4-year all sky survey in the 0.1-10 keV range using an array of seven telescopes. • ART — a hard X-ray telescope from IKI. • Spectrum-X Calorimeter (SXC) — will measure the soft X-ray diffuse background • Uses an eighth eROSITA mirror and a 6 6 microcalorimeter • Effective areas: 33 cm2 at 6 keV, 280 cm2 at 1.5 keV, and 100 cm2 below 0.28 keV. • The field of view is 11’ 11’ with 1.8’ square pixels. • The mirror has a half-power diameter ~15”, so the pixels are sharply defined. • Energy resolution is 6 eV FWHM with a goal of 4 eV. • The 4-year survey will provide high-quality spectra for every 5° 5° area on the sky with useful spectral information on much finer scales, and very high precision and sensitivity to weak lines when larger areas are averaged. • The intention is to make all the data public on a short time scale
A few more facts • Detector: 6 x 6 array with 0.815 x 0.815 mm2 pixels, with 6 eV @ 6 keV, Top = 50 mK. (Alternative design originally developed for XRS.) • Mirror: eRosita (15’’ HPD, 400 cm2 @ 1 keV, 40 cm2 @ 6 keV) • Cooler: NeXT design (mechanical pre-coolers + ADR, LHe for reliability) • Lifetime requirement > ½ year, potential >5 years
The mirror is slightly larger than the XRS mirror, but has a much shorter focal length, making the effective area smaller at high energies. The field of view is 14 times larger than XRS, so net throughput is larger all to way to 10 keV for a source that fills its 11 arc-minute field.
Comparison with existing high-resolution spectrometers (HEG, MEG, RGS)
Observation Plan • Performance Validation: • 6-month pointed phase • Includes initial calibration • Long observations of 20-40 nearby clusters primarily to determine velocity dispersions. • Temperature profiles and abundances will also be obtained to beyond the virial radii.
The pointed phase will yield 30 to 40 high-quality Fe line spectra. Shown here are Fe lines from a hot cluster at redshift 0.02, plotted as a ratio to the bremsstrahlung continuum. Four of the He-like lines are visible, as are the two H-like lines, allowing detailed plasma diagnostics.
A1413 w/XMM Simulated 300 ks SXC exposure of A1413. Similar exposures will yield turbulent velocity measurements for any of the 30-40 brightest hot clusters. In this simulation of the Fe XXV lines, the input turbulent velocity of 400 km/s is easily distinguished from models with lower and higher values.
C and N abundances can be measured at the ±20% level from a cluster with a flux of 4×10–11 ergs/cm2/sec. The inset shows the 68, 90, and 99% confidence contours for the C and N abundance with respect to solar.
SXG All-Sky Survey • 4-year all-sky survey: • Eight ROSAT-type surveys in succession • The high-coverage scan poles moved about half way from the ecliptic poles toward the Galactic poles, and wobbled to provide uniform deep coverage of about 100 square degrees at each pole.
Typical 5° x 5° field from the 4-year all sky survey. The simulation is for a multi-component fit to Suzaku observations near the North Ecliptic Pole, assuming filters identical to those used for the Suzaku XRS.
Typical 5° x 5° field from the 4-year all sky survey. The simulation is for a multi-component fit to Suzaku observations near the North Ecliptic Pole, assuming filters used on the new sounding rocket – which we hope to use for the SXC.
Spectrum for a typical mid-latitude field of 5° x 5° extent from the survey. • ~1600 independent spectra of this quality over the full sky • Considerably more detail in the high-exposure regions around the survey poles. • 1.8’ pixels allow efficient removal of point sources and other interferences.
Zooming into the 0.1 – 0.8 keV region. • Dotted line shows the same spectrum at CCD resolution • eRosita data, albeit with lower resolution, will provide higher spatial resolution data and far more counts – allowing the continuum to be precisely measured.
The only existing high resolution spectrum of the 1/4-keV diffuse background, obtained by the Diffuse X-ray Spectrometer. The fit shown is the best found: a 106 K equilibrium thermal spectrum with independent depletions in Si, Mg, and Fe
A simulation of the SXC sky survey result from the same region of sky near the Galactic plane using the same model. The calorimeter is not superior everywhere; trade is at ~ 60 Å.
Summary – Just the Facts • Launch: 2011 (2012?) • 6 month pointed phase, 4 year all-sky survey, 0.1-10 keV • Will get ~1600 independent 5 sq. degree fields on the sky with excellent statistics – and brighter regions can be smaller or have better statistics. • The field of view is 11’ 11’ with 1.8’ square pixels. • Pixels are significantly larger than the mirror PSF. • Energy resolution is 6 eV FWHM with a goal of 4 eV. • The intention is to make all the data public on a short time scale


![-A g [X g ]](https://cdn3.slideserve.com/5611649/a-g-x-g-dt.jpg)