Download
1 / 24
240 likes | 274 Vues
Learn about the National Commodity Crop Productivity Index (NCCPI) and how it evaluates soil productivity using a fuzzy system model. Discover its impact on risk management, economic research, and real estate assessment. Explore the different data sources and parameters used in NCCPI and its potential future applications. Check out the NCCPI user guide for more information.

E N D
Update of the National Commodity Crop Productivity Index Robert Dobos National Soil Survey Center 12 October 2011
Outline • A. Background, why NCCPI? • B. What is it? • C. How does it work? • D. What is different? • E. How good is it? • F. Future
A. Background • A need existed to be able to array soils nationwide on the basis of their inherent productivity • NCCPI is not intended to replace state crop indices that work well for the area intended • This NCCPI is currently for dryland agriculture
Theory • Use-invariant soil properties are a major factor in production (management is assumed to be good) • A crop is grown: 1) in/on a soil 2) on a landscape that is 3) subjected to a climate, one group of properties is not enough to make a prediction • A three-part model is needed to account for the climatic regions where crops are best adapted (frigid, mesic, thermic)
Projected users FSA could use as a part of the rental rate calculation for their programs Risk Management Agency (RMA) could use to help determine premiums and detect fraud Economic Research Service could use to help in projections of productivity Real estate assessors could use to inform purchase decisions
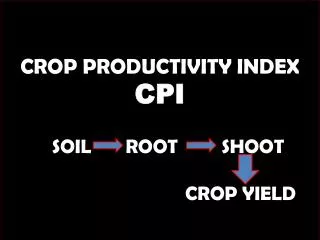
B. What is it? • NCCPI is a fuzzy system model that uses data and relationships found in the soil survey database (NASIS) to rate the properties of a soil component against a membership function
Some soil, landscape, and climate parameters have greater impact on productivity and others lesser • Some soil properties are not independent • Some properties are only important in the extreme • Look at the shape of the curve
Data Used by NCCPI – Physical • Root Zone Available Water Holding Capacity • Bulk Density • Saturated Hydraulic Conductivity • LEP (Shrink-Swell) • Rock Fragment Content • Rooting Depth • Sand, Silt, and Clay Percentages
Data Used by NCCPI – Chemical • Cation Exchange Capacity • pH • Organic Matter Content • Sodium Adsorption Ratio • Gypsum Content • Electrical Conductivity
Data Used by NCCPI – Landscape • Slope Gradient and Shape • Ponding Frequency, Duration, and Timing • Flooding Frequency, Duration, and Timing • Water Table Depth, Duration, and Timing • Erosion • Surface Stones • Rock Outcrop • Other phase features (channeled, etc)
Data Used by NCCPI – Climate • Mean Annual Precipitation • Mean Annual Air Temperature • Frost Free Days • Major Land Resource Area • Soil Temperature Regime (Soil Taxonomy)
C. How does it work? • NCCPI looks similar to the Storie Index • Soil property scores are multiplied together • One low property score can thus drag down the overall score • Hedges modify the fuzzy numbers from the major groups: Chemical, Physical, Landscape, Water, and Climate • The highest score of the Corn and Soybeans, Small Grains, or Cotton modules is the score for a component
C. What is different? • “Sufficiency” is borrowed from the Missouri productivity index for RZ AWC • The way the score from negative soil attributes is handled is improved • Seasonal soil wetness depiction in cotton growing soils is improved • pH and LEP stratified by MAP where needed • MAP stratified by MAAT where needed
E. How good is it? • Smoothing Spline, Linear, and Orthogonal Fits • R-square of this is 0.41 • “Poster Child” for “data harmonization” • Also, a good way to check data
Data checking • Populated yields should be supported by the properties of the soil component • Usually, frequently flooded soils are not farmed • Cotton needs at least 180 to 200 frost-free days
Data checking • Sometimes the yield data needs to be updated • Other data needs to be coordinated if a component exists in a broad geographic area
Data checking • The frost-free days data is the only soil/site/climate property that is different for the highlighted series
Data checking As data is harmonized, the shapes, minima, and maxima of the various curves will be re-evaluated
F. Future • Next step is to get NCCPI data on to the Soil Datamart • To learn more about NCCPI, look at http://soils.usda.gov/technical/ the link to the NCCPI user guide is near the bottom of the page