Download
1 / 11
110 likes | 247 Vues
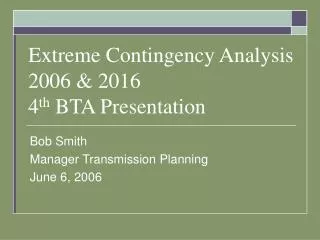
Extreme Contingency Analysis 2006 & 2016 4 th BTA Presentation. Bob Smith Manager Transmission Planning June 6, 2006. Study Assumptions. Utilize the 2006 heavy summer power flow case and re-run worst outage for 2016 Severity of outage determined by the ability to serve Phoenix load

E N D
Extreme Contingency Analysis2006 & 20164th BTA Presentation Bob Smith Manager Transmission Planning June 6, 2006
Study Assumptions • Utilize the 2006 heavy summer power flow case and re-run worst outage for 2016 • Severity of outage determined by the ability to serve Phoenix load • Corridors were chosen based upon exposure to forest fires • Cholla-Saguaro and Coronado-Silverking 500kV lines • Navajo South 500kV lines • Four Corners-Cholla-Pinnacle Peak 345kV lines • Glen Canyon-Flagstaff-Pinnacle Peak 345kV lines • PV East corridor not studied because there is no forestation 4th BTA
Study Assumptions • Transformer banks studied • Kyrene 500/230kV • Browning 500/230kV • Transformer banks not studied • Westwing 500/230kV transformers have additional spacing, fire walls, fire suppression, and oil retention pits • Rudd 500/230kV transformer outage is equivalent to outage of Palo Verde-Rudd 500kV line • Pinnacle Peak 345/230kV transformer outage is equivalent to outages of the 345kV lines into Pinnacle Peak. 4th BTA
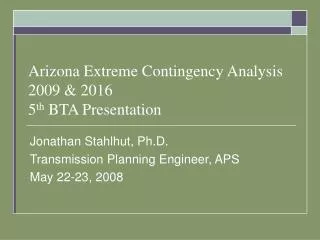
ARIZONA STATE EHV MAP GLEN CANYON TO NAVAJO CRYSTAL FOUR CORNERS MOENKOPI TO CALIF. TO MEAD / MARKETPLACE SELIGMAN COCONINO ROUND YAVAPAI VERDE FLAGSTAFF VALLEY CHOLLA CORONADO PREACHER GAVILAN CANYON PEAK WEST WING PINNACLE PEAK PALO VERDE- LIBERTY KYRENE HASSAYAMPA RUDD SILVERKING JOJOBA BROWNING KNOX DESERT REDHAWK BASIN CASA GILA RIVER TO CALIF. GRANDE N.GILA SANTA 500KV ROSA GILA BEND TAT MOMOLI SAGUARO YUCCA LEGEND TUCSON EXISTING 500 KV LINES EXISTING 345 KV LINES EXISTING 230 KV LINES POWER PLANT EXISTING 115 KV LINES NUCLEAR POWER PLANT 115KV & ABOVE SUBSTATION (EXISTING) 5/23/06 NORTH Substation locations and line routings depict an electrical connection only and Transmission Planning 4th BTA do not reflect any assumed physical locations or routing.
ARIZONA STATE EHV MAP GLEN CANYON TO NAVAJO CRYSTAL FOUR CORNERS MOENKOPI TO CALIF. TO MEAD / MARKETPLACE SELIGMAN COCONINO ROUND YAVAPAI VERDE FLAGSTAFF VALLEY CHOLLA CORONADO PREACHER GAVILAN CANYON PEAK WEST WING PINNACLE PEAK PALO VERDE- LIBERTY KYRENE HASSAYAMPA RUDD SILVERKING JOJOBA BROWNING KNOX DESERT REDHAWK BASIN CASA GILA RIVER TO CALIF. GRANDE N.GILA SANTA 500KV ROSA GILA BEND TAT MOMOLI SAGUARO YUCCA LEGEND TUCSON EXISTING 500 KV LINES EXISTING 345 KV LINES EXISTING 230 KV LINES POWER PLANT EXISTING 115 KV LINES NUCLEAR POWER PLANT 115KV & ABOVE SUBSTATION (EXISTING) 5/23/06 NORTH Substation locations and line routings depict an electrical connection only and Transmission Planning 4th BTA do not reflect any assumed physical locations or routing.
SUMMARY OF RESULTS (2006) • For all outages studied all load can be served & local Phoenix reserve requirements met • Some outages from remote generation would require redispatching from other available sources • Maximum redispatch requirement is ~800MW @ Navajo • Generation made up from available AZ and CA units • Some outages would require some system reconfiguration to alleviate overloads • Without system reconfiguration load reduction of up to 200MW is required for outages of corridors into Pinnacle Peak 4th BTA
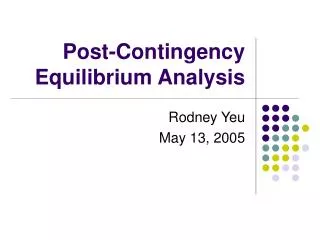
SUMMARY OF RESULTS (2016) • Outages of the lines coming into Pinnacle Peak were re-examined • For Glen Canyon to Pinnacle Peak outages, Glen Canyon remote generation needs to be redispatched; independent of Phoenix load • No system reconfiguration required • Phoenix local reserve requirement met • TS9 to Raceway 500kV line mitigates those outages 4th BTA
RACEWAY ARIZONA STATE EHV MAP GLEN CANYON TO NAVAJO CRYSTAL FOUR CORNERS MOENKOPI TO CALIF. TO MEAD / MARKETPLACE SELIGMAN COCONINO ROUND YAVAPAI VERDE FLAGSTAFF VALLEY CHOLLA CORONADO PREACHER GAVILAN CANYON PEAK WEST WING PINNACLE PEAK PALO VERDE- LIBERTY KYRENE HASSAYAMPA RUDD SILVERKING JOJOBA BROWNING KNOX DESERT REDHAWK BASIN CASA GILA RIVER TO CALIF. GRANDE N.GILA SANTA 500KV ROSA GILA BEND TAT MOMOLI SAGUARO YUCCA LEGEND TUCSON EXISTING 500 KV LINES EXISTING 345 KV LINES EXISTING 230 KV LINES POWER PLANT EXISTING 115 KV LINES NUCLEAR POWER PLANT 115KV & ABOVE SUBSTATION (EXISTING) 5/23/06 NORTH Substation locations and line routings depict an electrical connection only and Transmission Planning 4th BTA do not reflect any assumed physical locations or routing.
PHOENIX LOAD DURATION & RMR CONDITION (2006) Comparison 13000 12000 PEAK = 11,434 MW 11000 10000 Import = 9,250 MW 1,009 GWH 1,140 MW 9000 Import = 8110 MW 8000 7000 LOAD (MW) 6000 5000 4000 640 HOURS VALLEY LOAD 3000 2000 Total Valley Energy = 50,873 GWH 1000 0 0 1000 2000 3000 4000 5000 6000 7000 8000 9000 10000 HOURS 4th BTA