Download

1 / 78
1.24k likes | 2.07k Vues
Gartner Research Methodologies. Agenda. In this module we will cover the following topics: Gartner Research methodologies defined and described How our research methodologies provide client value How Gartner research methodologies differentiate Gartner from the competition

E N D
Agenda In this module we will cover the following topics: Gartner Research methodologies defined and described How our research methodologies provide client value How Gartner research methodologies differentiate Gartner from the competition How to use research methodologies in the sales process 2
Definition “Research Methodologies” [n]: Proprietary research constructs that effectively organize and convey information critical to key IT investment decisions 3
Types of Research Methodologies Market Scopes Hype Cycles Vendor Ratings Market Forecasts Market Share Magic Quadrants 4
Common Features } Easy to understand visual summaries Based on detailed analysis Developed based on extensive testing Regularly reviewed for ease of use and applicability to clients Continually refined to meet evolving client needs 5
Common Features Newer Methodologies have same common features SWOT IT Market Clock 6 Critical Capabilities
Depth of Research Clients like simplicity of these reports. Appearance of simplicity masks the rigorous research needed to generate each report we create. Reports are based on thorough, careful analysis of a great deal of information. Make sure your clients understand the unparalleled analyst expertise and depth of analysis that goes into each report. 7
Research Processes Behind Methodologies Qualitative Insight Research Market Scopes Vendor Ratings Hype Cycles Quantitative Market Research Market Forecasts Market Share 8 Magic Quadrants
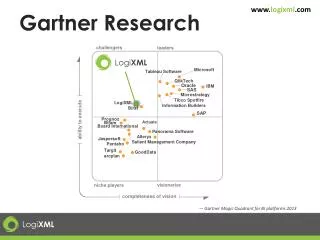
Magic Quadrants Magic Quadrants answer the question: “Which technology provider is the best partner for my needs?” 9
Magic Quadrants Graphical strategic planning models Position providers based on: “Ability to Execute” “Completeness of Vision” Market specific Published for over 20 years 10
Magic Quadrants Completeness of Vision • How well providers understand the future • Innovation, strategy, business model, match with Gartner’s view. Ability to Execute • Assessment of operations • Viability, marketing execution, product development, sales channels, customer experience 11
Magic Quadrants Analysts compile information from: • Providers • Clients • Partners • Competitors • Reference checks • Gartner’s extensive knowledge 12
Magic Quadrants Sources Providers are placed into one of four “quadrants”: • Leaders • Challengers • Niche players • Visionaries 13
Magic Quadrant: Leaders High “Ability to Execute” and “Completeness of Vision” Strong Companies Satisfied Customer base More resources Value-priced Focused on broadest market Size and Strength in challenging environment 14
Magic Quadrant: Challengers High “Ability to Execute” Lower “Completeness of Vision” No clear idea of market future Weaker plan for future success Must develop their vision 15
Magic Quadrant: Niche Players Low “Ability to Execute” and “Completeness of Vision” Narrow Focus Less capability or strategic narrow focus 16
Magic Quadrant: Visionaries Low “Ability to Execute” High “Completeness of Vision” Vision aligns with Gartner’s market views Do not have proven capabilities Often first to introduce new technology 17
Magic Quadrant: Interactive Clients can review the analysis on other providers in the market Provide individual company analysis in lists of strengths and cautions 18
Magic Quadrant: Interactive Magic Quadrant for Application Delivery Products When we select Cisco Systems, provider analysis is presented in “strengths” and “cautions” 19
Magic Quadrant: Example Global Enterprise Notebook PCs Very important to largest clients Clients use this report to make purchasing decisions Dell, HP, Lenovo are high in the Leaders quadrant Fujitsu/Siemens and Toshiba are high on “Completeness of Vision” Apple and Panasonic are niche players 20
Magic Quadrants: Summary Help end-user clients decide on the best technology provider to meet their needs Help clients understand their position in the competitive landscape Help clients make more informed investment decisions. 23
Magic Quadrant vs Forrester Wave Gartner Advantages: • Gartner has produced 5 times of Magic Quadrant than Forrester Wave • Gartner holds 6 times the number of vendor briefings as Forrester. • Gartner uses many more data sources to develop Magic Quadrants, which result in more objective analyses. 24
Magic Quadrant vs Forrester Wave Forrester Wave disadvantage: Forrester outsources their product analysis They do not directly control an important data source Forrester analysis lacks objectivity Relies primarily on inputs from providers who are being evaluated 25
MarketScopes MarketScopes answer the question: “Which technology providers in a new or mature market are the best match for my needs?” 26
MarketScopes MarketScopes evaluate providers in a specific market space Magic Quadrants are used in the prime of the market cycle MarketScopes are used early or late in a market’s evolution 27
MarketScopes MarketScopes help clients understand technology provider options Rates providers in a limited number of categories Provide insight into company’s performance against Gartner’s vision for the market Evaluate the market itself in terms of maturity and long-term viability 28
MarketScopes: Example 1 E-mail Systems The strongest providers is Microsoft Use caution when considering Open-Xchange 29
Benefits of MarketScopes Help select the best partners in new or mature markets Show position and the competitive landscape Show benefits and risk investing in new or mature markets 30
Benefits of MarketScopes Only Gartner provides this assessment The only widely used methodology focused on comparing providers in emerging and mature markets The only methodology that rates the market itself 31
Hype Cycle Hype Cycles answer the question: “How is this technology going to evolve?” 32
The Hype Cycle Predicts the lifecycle for emerging technologies Evaluates: Visibility and Maturity The Hype Cycle is based on five stages. 33
The Hype Cycle: Technology Trigger Technology Trigger New product or technology is introduced. Commercial viability is unproven New technology generates inflated expectations and unrealistic projections 34
The Hype Cycle: Peak of Inflated Expectations Peak of Inflated Expectation Few successes with technology and many failures 35
The Hype Cycle: Trough of Disillusionment Trough of Disillusionment Technology has entered mainstream and there is little media attention Technology only continues if they improve their products 36
The Hype Cycle: Slope of Enlightenment Slope of Enlightenment Technology is understood and can be applied Second- and third-generation products appear Few remaining bugs to be worked out 37
The Hype Cycle: Plateau of Productivity Plateau of Productivity Benefits of the technology are accepted Technology has been adopted by most enterprises Broad market applicability 38
The Hype Cycle: Prediction of Time Predicts from “less than two years” to “More than ten years. Predictions are designated by the shape and pinpoints the hype cycle location 40
The Hype Cycle: Prediction of Time Embedded Cellular Data is moving up the Slope of Enlightenment It is predicted to be less than two years away from mainstream adoption 41
The Hype Cycle: Priority Matrix Predicts the potential benefit resulting from the technology. Benefits: Transformational technologies, high and moderate ratings, low benefit rating Anticipated years to mainstream adoption of the technology. 42
Priority Matrix: Example HVDs are predicted to have high benefits to organizations in less than two years “PC Application-Streaming Technologies” and “PC Virtualization Software” show a longer time before mainstream adoption 43
The Hype Cycle: Summary Help clients to implement new and existing technologies Help clients get a look into the future to inform product development strategy and investment decisions Provide insight for marketing messages Help investment professionals determine which companies are best positioned to benefit from IT trends 44
The Hype Cycle: Summary A key research methodology that helps differentiate Gartner from others Gartner provides clients with objective assessments 45
Vendor Ratings Vendor Ratings answer the question: “How healthy is a specific technology provider organization?” 46
Vendor Ratings Rates the provider’s overall corporate financials, organization, management, marketing strategies, and support Based on assessment of the provider’s strategy and ability to deliver for a product or service. 47
Vendor Ratings: Summary Help assess provider’s health, capabilities and markets and services Provide key support for provider’s purchase and renewal decisions Companies can see their own perceived strengths and weaknesses, and the strengths and weaknesses of their competitors and suppliers Help investment professionals make decisions and manage risks 50