Download
1 / 16
200 likes | 432 Vues
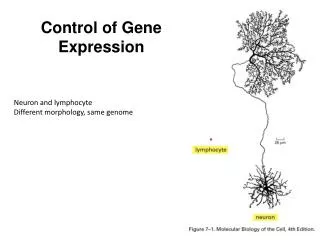
Control of Gene Expression. Neuron and lymphocyte Different morphology, same genome. Genomes contain in the DNA sequence the information to make many thousands of different RNA and protein molecules

E N D
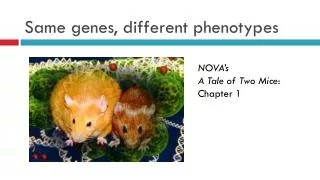
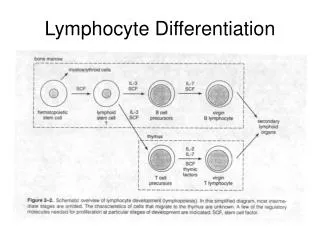
Control of Gene Expression Neuron and lymphocyte Different morphology, same genome
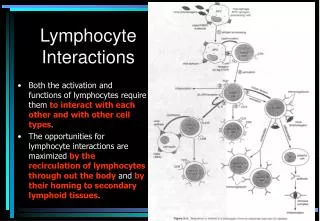
Genomes contain in the DNA sequence the information to make many thousands of different RNA and protein molecules A cell expresses only a fraction of its genes and different types of cells in multicellular organisms arise because different set of genes are expressed. Cells can also change the pattern of genes they express in reponse to changes in the environment Six Steps at which eucaryotic gene expression are controlled For most genes the initiation of RNA transcription is the most important point of control
Regulation at DNA levels Double helix Structure
DNA recognition code From the major groove, each of the four base-pair configurations projects a unique pattern of features. From the minor groove, however, the patterns are similar for G-C and C-G as well as for A-T and T-A.
One typical contact of Protein and DNA interface In general, many of them will form between a protein and a DNA. The interactions are both highly specific and very strong.
Helix-turn-Helix C-terminal binds to major groove, N-terminal helps to position the complex, discovered in Bacteria
Homeodomain Protein in Drosophila utilizing helix-turn-helix motif
Regulation of tryptophan synthesis (negative control) Operon: genes adjacent to each other and are transcribed from a single promoter When tryptophanis present in the growth medium and enters the E.coli cell (e.g. the bacterium is in the gut of a mammal that has just eaten a meal of protein), synthesis of trytophan is no longer needed. Tryptophan binds to the repressor thus activating it.
The binding site of Lambda Repressor determines its function The Lambda repressor is encoded by a bacterial virus, the bacteriophage lambda. The repressor shuts off the viral genes that code for the protein components of new virus particles and thereby enables the viral genome to remain a silent passenger in the bacterial chromosome multiplying with the bacterium when conditions are favorable for bacterial growth. Act as both activator and repressor
Combinatory Regulation of Lac Operon CAP (catabolite activator protein) activates genes that enable E.coli to use alternative carbon sources when glucose, its preferred carbon source, is not available. Falling levels of glucose induce an increase in the signaling molecule cyclic-AMP which binds to the CAP protein, enabling it to bind to its specific DNA sequence. The lac repressor ensures that the lac operon is also shut off in the absence of lactose.
Autoregulatory gene model Consider a simple model of gene regulation. The response function is saturating (a sigmoid function). Here we have an autoregulatory gene which autoregulates positively and is downregulated externally (the signal θ). where θ and h (the sigmoid slope) are parameters. Note that where f(x)>0 the derivative is positive and x(t) will increase. Where f(x)<0 the derivative is negative and x(t) will decrease.
Autoregulatory gene model • The steady state(s) occur when f(x)=0, and therefore • Assuming θ=1, when we move from h=3 to h=5, we go through a bifurcation in which we change from a single fixed point to a bistable system with two stable fixed points and one unstable fixed point.
Exercise Consider the case θ=1, h=3. 1. Plot f(x) to see where the single steady state is. Next to it, plot x(t) for several initial conditions x(0) ranging from 0 to 1 in intervals of 0.1. for t=0→10. 2. Repeat for h=5.
Note that the derivative is negative at stable fixed points and positive at unstable fixed points