Download

1 / 42
420 likes | 560 Vues
An Overview of Leveraged Buyouts Chris Droussiotis, Executive Director Head of the Leverage & Sponsor Group June 2013. Table of Contents. Leverage Buyouts (LBO) Definition History Market evolution Financing an LBO / Capital Markets Senior Debt Subordinated Debt Equity Debt Capacity

E N D
An Overview of Leveraged Buyouts Chris Droussiotis, Executive Director Head of the Leverage & Sponsor Group June 2013
Table of Contents • Leverage Buyouts (LBO) • Definition • History • Market evolution • Financing an LBO / Capital Markets • Senior Debt • Subordinated Debt • Equity • Debt Capacity • Loan Syndication • Definition (Primary / Secondary • Market Overview / Market Evolution • Investor Base / CLOs, Loan Funds and Banks • Understanding Term & Conditions • Money Terms • Non-Money Terms • Other Terms • Loan Pricing • Loan Pricing / Spread / OID / LIBOR Floors • Bond Pricing YTM, YTC, YTW • Equity Return Analysis (DCF) 6. Example of a Large Syndication: Harrahs 2
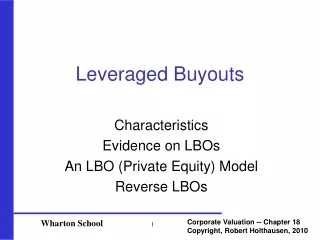
Leveraged Buyouts Definition/Description • A leveraged buyout (or LBO, or highly leveraged transaction (HLT) occurs when an investor, typically a financial sponsor acquires a controlling interest in a company's equity and where a significant percentage of the purchase price is financed through leverage (Debt). • The Debt raised (by issuing bonds or securing a loan) is ultimately secured upon the acquisition target and also looks to the cash flows of the acquisition target to make interest and principal payments. • Acquisition debt in an LBO is usually non-recourse to the financial sponsor and to the equity fund that the financial sponsor manages. • The amount of debt used to finance a transaction as a percentage of the purchase price for a leverage buyout target, varies according to the financial condition and history of the acquisition target, market conditions, the willingness of lenders to extend credit. Typically the debt portion of a LBO ranges from 50%-85% of the purchase price, but in some cases debt may represent upwards of 95% of purchase price. • To finance LBO's, private-equity firms usually issue some combination of syndicated loans and high yield bonds. 3
Leveraged Buyouts History & Market Evolution • The first leveraged buyout may have been the purchase of two companies: Pan-Atlantic and Waterman companies (steamship companies) in 1955 by McLean Industries. • McLean borrowed $42 million and raised an additional $7 million through an issue of preferred stock. • When the deal closed, $20 million of Waterman cash and assets were used to retire $20 million of the loan debt. • The Debt raised (by issuing bonds or securing a loan) is ultimately secured upon the acquisition target and also looks to the cash flows of the acquisition target to make interest and principal payments. • The use of publicly traded holding companies as investment vehicles to acquire portfolios of investments in corporate assets was a relatively new trend in the 1960s, popularized by the likes of Warren Buffett via Berkshire Hathaway and Victor Posner via DWG Corporation. • The leveraged buyout boom of the 1980s was conceived by a number of corporate financiers, most notably Jerome Kohlberg, Jr. and later his protégé Henry Kravis and his cousin George Roberts – both working for Bear Stearns – to create KKR. • In 1989, KKR closed in on a $31.1 billion dollar takeover of RJR Nabisco. It was, at that time and for over 17 years, the largest leverage buyout in history. The event was chronicled in the book (and later the movie), Barbarians at the Gate: The Fall of RJR Nabisco. • Drexel Burnham Lambert was the investment bank most responsible for the boom in private equity during the 1980s due to its leadership in the issuance of high-yield debt. • Mega Deals of 2005-2007: The combination of decreasing interest rates, loosening lending standards, creation of CLOs and regulatory changes for publicly traded companies (specifically the Sarbanes-Oxley Act.) would set the stage for the largest boom private equity had seen. 4
Leveraged Buyouts – Enhancing Equity Returns Your Business Income Statement Balance Sheet EBIT : $1.5 million Interest Exp.: $ 0 million Pretax Income: $1.5 million Taxes (33%): $0.5 million Net Income: $1.0 million ASSETS: $10 million LIABILITIES: $0 (No Debt) EQUITY: $10 million ROA = 10% ROE = 10% The offer: $10mm (10 x Net Income) borrowed $9 million (90%) at 10% LBO: NewCo Income Statement Balance Sheet EBIT: $1.5 million Interest Exp.: $ 0.9 million Pretax Income: $ 0.6 million Taxes (33%): $ 0.2 million Net Income: $ 0.4 million ASSETS: $10 million LIABILITIES: $9 million EQUITY: $1 million ROA = 10% ROE = 40% 5
Leveraged Buyouts – Enhancing Equity Returns Your Business Income Statement Balance Sheet EBIT : $1.5 million Interest Exp.: $ 0 million Pretax Income: $1.5 million Taxes (33%): $0.5 million Net Income: $1.0 million ASSETS: $10 million LIABILITIES: $0 (No Debt) EQUITY: $10 million ROA = 10% ROE = 10% 20% Premium The offer: $12 mm (12 x Net Income) borrowed $10.8 million (90%) at 10% LBO: NewCo Income Statement Balance Sheet EBIT: $1.50 million Interest Exp.: $1.08 million Pretax Income: $ 0.42 million Taxes (33%): $ 0.14 million Net Income: $ 0.28 million ASSETS: Purchase: $10 million Goodwill: $ 2 million Total: $12 million LIABILITIES: $10.8 million EQUITY: $ 1.2 million ROA = 10% (tang) ROE = 23% 6
Capital Markets: Types of Financing • Senior Debt (Bank Loan or Leverage Loan) • Ranks ahead of all other debt and equity capital in the business • Bank loans are typically structured in up to three tranches: Revolver, TL A and TL B. • The debt is usually secured on specific assets of the company, which means the lender can automatically acquire these assets if the company breaches its obligations under the relevant loan agreement; therefore it has the lowest cost of debt. • Typical Maturity 5-7 years • Senior Debt represent 45-60% of total Capital • Senior Debt Multiples represent 3.0x – 4.0x of historic EBITDA • Revolver and TL A (called Pro-rata facilities) are provided by traditional banks • Term Loan B (called institutional facility) is provided by non-banking institutions (CLOs, Insurance Co., Funds) Pros Cons • Usually offers the lowest cost of funding • Prepayable at no or little cost • Deep established market in the U.S which can accommodate large transactions • Private market and therefore less exposed to volatile market conditions • No equity dilution • Requires periodic amortization out of free cash flows, therefore this instrument may not be suitable for companies consuming cash for some years • Strict maintenance covenants are tightly monitored, usually on a quarterly basis (eg total leverage, interest cover, fixed charge cover ratio, etc) • Full security required in most cases 7
Capital Markets: Types of Financing • Subordinated Debt (Mezzanine) • Ranks behind senior debt in order of priority on any liquidation. • The terms of the subordinated debt are usually less stringent than senior debt. • Repayment is usually required in one ‘bullet’ payment at the end of the term. • Typical maturity is 8-10 years • Since subordinated debt gives the lender less security than senior debt, lending costs are typically higher. • An increasingly important form of subordinated debt is the high yield bond, often listed on US markets. • They are fixed rate, publicly traded, long-term securities with a looser covenant package than senior debt though they are subject to stringent reporting requirements. • High yield bonds are not prepayable for the first five years and after that, they are prepayable at a premium (Call premiums) • SEC requires the Issuer of these bonds to be rated by two independent agencies (Moody’s and S&P) • Subordinated Debt represent 15-25% of total Capital • Total Debt (including both the Senior and Sub debt represent 5.0x – 6.0x of historic EBITDA. • Private Equity • Ranks at the bottom of the “waterfall” in order of priority on any liquidation. • Equity represent 20-35% of total Capital 8
Capital Markets: Types of Financing • Estimate Debt Capacity • The next step is to estimate the amount of debt that the company can take on. • The financial statements should make provisions for interest and debt costs. • The company can only bear debt to the extent that it has available cash flows. Note that all existing debt will need to be refinanced. When modelling (Equity or Debt investors) the financing assumptions used are according to market conditions, industry characteristic and company specific issues. Set out below are some parameters that will influence financing considerations for the model: • Minimum interest cover (times) • Total debt/EBITDA (times) • Senior debt repayment (in years) • Mezzanine debt repayment (in years) • Senior debt interest rate • Subordinated interest rate • Mezzanine finance exit IRR 9
Capital Markets: Types of Financing Example: XYZ Company trades at NYSE at $15 with 20 million shares and has $300 million of Debt, $100 of Cash and $100 mm of EBITDA, so Trading Enterprise Value (EV) = (Equity at $15 x 40 million shares) + $300 mm Debt – $ 100 mm Cash = $800 mm or 8.0x EBITDA trading multiple ( EV / EBITDA) The PE firm are in the process of tendering for all the shares of XYZ. To ensure a success of acquiring all the shares, they thinking of offering 33% premium to the existing trading level stock, or tendering for the stock at $20 per share putting he EV at $1 billion - ($20 x 40 mm shares ) + $300 mm Debt - $100mm Cash = $1 billion The PE firm will need to run their own LBO Analysis to see if $1 billion acquisition makes sense given the Debt Capacity and improvement of EBITDA in the next 3-5 years. 10
Loan Syndication Background & History • A syndicated loan is one that is provided by a group of lenders and is structured, arranged, and administered by one or several commercial or investment banks known as Arrangers. • Arrangers serve the investment-banking role of raising investor dollars for an issuer in need of capital. • The issuer pays the Arranger a fee for this service, and this fee increases with the complexity and risk factors of the loan. • In the Mid-1980’s when the larger buyouts needed bank financing, the syndicated loan market became the dominant way for issuers to tap banks and other institutional capital providers for loans. • In the late 90s to early 2000’s hundreds of Collateral Loan Obligation funds (CLO’s) were created and joined the loan syndication process. These funds were referred to as non-bank institutions or institutional investors. These institutional investors played a key role in the exponential growth of the Mega LBO deals seen in 2005-2007. • By 2007, nearly 75% of the loans were provided by non-banks, versus less than 20% 10 years earlier. • The Fall of 2007 – the end of liquidity in the U.S Syndication market – Traditional Banks had to step up in the months and years to follow the liquidity crisis. • For two years after the crisis (2007-2009), the syndication market has completely changed; Was more cautious, new language was added in the syndication agreements between the banks and the customers to protect against market risk • Starting in the summer of 2010 through today, the syndication markets started to loosen up again as the liquidity in the loan market has come back significantly. In 2010, the HY bond market issuance had the best year ever. 11
Two Markets Served • Investment Grade Loan Market • Rated BBB- and Higher (Corporate) • Arrangers hold Higher Exposure ($200 million +) • The majority of the Syndicate are traditional banks • Leveraged Loan Market • Rated BB+ and Lower (Corporate) • Arrangers hold Lower Exposure – thus the need to syndicate • The majority of the Syndicate are non-banks (Financial institutions) • Leverage Loan Market purpose: • Leverage Buyouts (LBO) • Acquisitions using substantial debt • Refinancing 4
Two Markets Served in the U.S. Investment Grade Loan Market Leveraged Loan Market (BB+ and below) $535 Billion $715 Billion $229 Billion 13
Loan Syndication Market Overview (Continued) The Exponential Surge in Supply of Syndicated Loans was driven by large Leveraged Buyouts starting in 2005 thru the summer of 2007 $37.9 $33.0 Hi Yield $11.25 $28.4 Hi Yield $11.3 $22.3 Hi Yield $13.22 Other (CMBS) $7.25 Leveraged Loan$26.65 $11.3 Hi Yield $6.03 Leveraged Loan$21.7 $8.0 Leveraged Loan$15.185 Hi Yield $3.0 Leveraged Loan$11.3 Leveraged Loan$9.0 Leveraged Loan$5.0 28 Mar 05 20 Nov 05 24 Jul 06 2 Oct 06 26 Feb 07 30 Jun 07 Source: LoanConnector 14 Extremely high liquidity in the market gave banks confidenceto underwrite larger and larger deals…
Loan Syndication Market Overview (Continued) Institutional Investors through June 2007 dominated the market Loan Syndication Participants: Source: Deutsche Bank Over time, institutional investors have replaced banks as lenders with over 75% of demand coming from institutional investors as of LTM 6/30/07 15
Loan Syndication Market Overview(Continued) – Lessons LearnedThe Leverage Loan Syndication Supply and Demand Imbalance After (2nd Half 2007(2)) As of 12/05/07 Before (LTM June 30, 2007(1)) ($ in Billions) $350 $620 $620 $162 B (46.3%) Capital Required to Absorb Excess Supply (4) $95 (15%) $350 $45 (14.5%) $50 Liquidation / Collateral Calls Cross-overInvestor / Distress Buyer / Opportunity Funds $120 (19.3%) (3) $33 (9.4%) $95 (15%) Hedge Funds / HY $50 (14.3%) Other $620 (3) $50 (14.3%) Primary $310 (50%) $10 (3.5%) Issuance(5) Banks $300 CLOs (2) (2) Demand Supply Investor Landscape has changed • Sources: • (1) Standard & Poor’s Leveraged Lending Review 2Q07 • (2) Demand assumptions: Banks and Other at 35% consistent with LTM 6/30/07; CLO, Hedge Fund and New Capital amounts Wall Street estimatesSupply assumptions: Primary Issuance based on current estimated forward calendar; Liquidation / Collateral Calls amounts Wall Street estimates • Finance Companies, Insurance Companies, Prime Rate Funds • Standard & Poors LCD News 12/5/07 • (5) Grossed up for ordinary issuance 16
The Secondary Loan Market took a plunge as a result of oversupply at the time of financial crisis. New Issue Loans with LIBOR Floor, higher Spread pricing and tighter structures post 2007 17
Types of Loan Syndication Formats • Underwritten deal • Best-efforts syndication • Club deal 18
Types of Loan Syndication Formats (Continued) • Underwritten deal • Arrangers guarantee the entire commitment, then syndicate the loan to reduce their exposure. • If the arrangers cannot fully subscribe the loan, they are forced to absorb the difference. • Reasons for Arrangers to underwrite: • Offering an underwritten loan can be a competitive tool to win mandates. • Underwritten loans usually require higher fees • New Terms: • “Flex Language” • Memorandum of Understanding (MOU) 19
Types of Loan Syndication Formats (Continued) • Best-efforts syndication • The Arranger commits to underwrite less than the entire amount of the loan. • If the loan is undersubscribed, the deal may not close unless the terms/pricing/structure are changed. • Best-efforts syndications were used for risky borrowers or for complex transactions. 20
Types of Loan Syndication Formats (Continued) • Club deal • Pre-marketed to a group of issuer’s or equity sponsor’s relationship lenders. • Typically a smaller loan (usually $25 million to $200 million but as high as $500 million) • The arranger is generally a first among equals, and each lender gets a full cut of the fees. 21
The Loan Syndication Process Lead Arranger Bank Administrative Agent Issuer /Company Bookrunner Bank #1 Syndication Agent Bookrunner Bank #2 Documentation Agent Bookrunner Bank #3 Documentation Agent First Tier Co-Mgr Bank #1 Co-Mgr Bank #2 Co-Mgr Bank #3 Co-Mgr Bank #4 Co-Mgr Bank #5 Co-Mgr Bank #6 Second Tier Bank or Institution Bank or Institution Bank or Institution Bank or Institution Bank or Institution “Retail” Level Bank or Institution Bank or Institution Bank or Institution Bank or Institution Bank or Institution Bank or Institution Bank or Institution Bank or Institution Bank or Institution Bank or Institution 22
The Loan Syndication Process (Continued) • The issuer or Company solicits bids from Arrangers. • Arrangers will outline their syndication strategy and their view on the way the loan will price in market. • Issuer gives the mandate to one or more Arrangers (Co-Arrangers) • The arranger will prepare an information memo (IM) describing the terms of the transactions. • The IM typically will include: • Executive Summary • Investment Considerations • Summary of Terms and Conditions (Term Sheet) • Transaction Overview • Company • Management and Equity Sponsor Overview • Industry Overview • Financial Model • Timing for commitments, closing, as well as fees on level of commitments • Bank meeting is scheduled at which potential lenders hear the management and the Investor group. • A deadline is given for the banks to send their commitment levels subject to final documentation • Each Bank analyzes the deal’s credit and assess the pricing (RORA). Each Issuer is assigned an internal rating. • The Arranger collects all commitments – different amounts from each Bank • Allocations are given and Legal Documentation is sent for their final review. • If the Deal is Oversubscribed, the allocation of each bank will most likely be reduced • If the Deal is Undersubscribed, depending on the FLEX language, the pricing could be Flexed up. • After Review of Legal Documentation by each lender and signatures are sent, the Deal closes and funds. 23
Typical Leveraged Deal Term Sheet / Credit Agreement • 1. Parties to the Credit Agreement: • Borrower • Holding Company • Guarantor / Parent and Subsidiaries’ Guarantee • Agent Banks • Administrative Agent • Collateral Agent • Syndication Agent • Documentation Agent • Law Firms representing the Borrower and Agent Banks 2. Description of the Transaction / Purpose of the Loan (s) 24
Typical Leveraged Deal Term Sheet / Credit Agreement (Continued) • Money Terms: • Amount / Tranches • Revolving Credit • Term Loans • Pricing • Interest Rate / Margin over LIBOR • Commitment Fees on unfunded portion • Maturities • Amortization Schedule (set principal payments) Need 100% Vote from the syndicate banks to amend these terms 25
Typical Leveraged Deal Term Sheet / Credit Agreement (Continued) • 4. Non-Money Terms: • Financial Covenants • Negative Covenants • Affirmative Covenants Need Majority Vote (typical 51%) from the syndicate banks to amend these terms 26
Typical Leveraged Deal Term Sheet / Credit Agreement (Continued) New Terminology in 2006 and 2007: Covenant Lite Structures (“Covy lite”) Incurrence Tests Vs Maintenance Tests Typical Financial Covenants Maximum Leverage Ratio (Total Debt / EBITDA) Maximum Senior Leverage Ratio (Bank Debt / EBITDA Minimum Coverage Ratio (EBITDA / Interest Minimum Fixed Charge Ratio (EBITDA – Capex – Taxes ) / Interest + Principal Payments) Maximum Capital Expenditures Minimum Tangible Net Worth New Terminology in 2006 and 2007: “Green Shoe” Typical Negative Covenants Limitations on Additional Debt Limitations on Asset Sales / Mergers & Acquisitions / Sale/leaseback transactions Limitations of Dividends / Investments Limitation on Liens / Negative Pledges Excess Cash Sweep Limitations of Change of Ownership 27
Typical Leveraged Deal Term Sheet / Credit Agreement (Continued) • Other Terms & Conditions: • Security / Liens / Guarantees • Mandatory Prepayments • Optional Prepayments / Call Protection • Financial Reporting / Maintaining Corporate Existence (“Affirmative Covenants”) • Representation and Warranties • Conditions Precedent at Closing • Events of Default • Assignments and Participations / Secondary Sales • Waivers and Amendments • Indemnification • Cross Default • Material Adverse Clause (MAC) 28
Senior Debt / Loan Pricing Other Terminology to the Credit Agreement • LIBOR Floor • Original Issuer Discount (OID) • Margin Spread A typical calculation of Loan Yields in the secondary market for loans: LIBOR or LIBOR Floor + Margin Spread + (100-OID)/4* years = Loan Yield *market convention is to use 4 years as it represents the average life Example: LIBOR Floor = 1.00% Margin Spread = 400 basis points (or 4.00%) OID = 98 Then the Loan Yield is calculated to: 1.0% + 4.0% + [(100 – 98)/100]/4 = 5.0% + (2.0% / 4) = 5.0% + 0.5% = 5.5% Yield 29
High Yield Bond Pricing • Concepts: • Face Value / Par Value ($1,000) • Market Value quoted as a % of Face Value (priced at 98 or 98% of $1,000) • Coupon Payments / Coupon (Interest Rate) • Semi Annual Payments (interest payments) • Callable / Non-Callable Bonds • YTM, YTC, YTW Yield to Maturity Vs Yield to Call • Other Bond Concepts: • Duration & Convexity • Convertible Bonds 30
Example of a Large Syndicated Loan Harrah’s Entertainment 35
Example of a Large Syndicated Loan Harrah’s Entertainment • TRANSACTION OVERVIEW • On December 19, 2006, Harrah’s Entertainment Inc. (“Harrah’s” or the “Company”) announced that it had entered into an agreement to be acquired by affiliates of Apollo Management (“Apollo”) and TPG Capital (“TPG”) in a transaction valued at approximately $31.2 billion (including estimated fees and expenses) • Harrah’s Entertainment, based in Las Vegas, Nevada, is the world’s largest and most geographically diversified gaming company, operating 50 casinos in six countries, with the #1 or #2 market share in almost every major gaming market in the U.S. • At the time of the acquisition, Harrah’s generated LTM 9/30/07 Net Revenues and Pro Forma Adjusted EBITDA of $10.6 billion and $2.9 billion, respectively. • Harrah’s Operating Company (“HOC”) owns or manages 43 of the 50 Harrah’s Entertainment casinos and generated LTM 9/30/07 Net Revenues and Pro Forma Adjusted EBITDA of $8.0 billion and $2.0 billion, respectively 36
Example of a Large Syndicated Loan Harrah’s Entertainment TRANSACTION SOURCES & USES 37
Example of a Large Syndicated Loan Harrah’s Entertainment STRUCTURE – TOO LEVERAGE?? Aggressive Structure?? 38
Example of a Large Syndicated Loan Harrah’s Entertainment CORPORATE STRUCTURE 39
Example of a Large Syndicated Loan Harrah’s Entertainment SUMMARY OF TERMS – SENIOR CREDIT FACILITY 40
Example of a Large Syndicated Loan Harrah’s Entertainment SYNDICATION PROCESS – WRONG TIMING FOR AN UNDERWRITTEN DEAL??? • The general syndication of Harrah's was launched 1/15/2008 with a bank meeting in New York. Over 1,000 bankers attended the general syndication meeting with commitments requested by 1/29/2008. • Unfortunately, given the: i) global correction in the financial markets on the week of January 21, 2008, ii) dramatic widening of high yield credit spreads and iii) reduction in the 3-month Libor Rate by at least 120 bps that followed, the secondary market loan prices pulled back materially and bank investors started to demand a much higher All-In Yield (about L+ 500) on primary market transactions, like Harrah's. • Investors were demanding All-In Yield of between L+ 450 - 500 to commit/purchase Harrah's Term Loan B. Since the offered TLB margin spread was L+300, investors were demanding a discount (OID) of between 92-93 (compared to the original OID offer of 96.5) from the Underwriters/Arrangers. • Following the failed syndication, Arrangers in order to reduce their exposure, were offering Harrah's TLB with an OID in the low 90's. 41
Example of a Large Syndicated Loan Harrah’s Entertainment SYNDICATION PROCESS – WRONG TIMING FOR AN UNDEWRITTEN DEAL?? (continued) • At the time, given such low demand, it was reported that Credit Suisse started to quietly syndicate their exposure prior to the commitment deadline (1/29/2008), independent of the other Arrangers. • As a consequence, each of the Arrangers started to syndicate their own exposure to their own investors offering as low as 90's OID to syndicate their exposure. • After that incident, there was a new agreement made between the Arrangers called The Memorandum of Understanding (MOU) where it prohibits one arranger to sell their exposure within an agreeable period (6 months after the commitments are due) without the consent of the other Arrangers. 42