MASS SPECTROMETRY INTRODUCTION
140 likes | 608 Vues
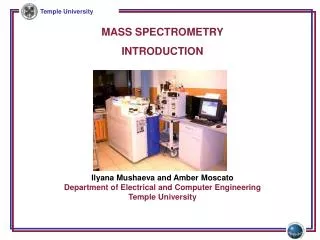
MASS SPECTROMETRY INTRODUCTION. Ilyana Mushaeva and Amber Moscato Department of Electrical and Computer Engineering Temple University. Spectrometry vs. Spectroscopy.

MASS SPECTROMETRY INTRODUCTION
E N D
Presentation Transcript
MASS SPECTROMETRY INTRODUCTION IlyanaMushaeva and Amber Moscato Department of Electrical and Computer Engineering Temple University
Spectrometry vs. Spectroscopy • Mass spectroscopy is an out of date term for mass spectrometry. Spectroscopy describes measurements involving electromagnetic radiation, such as infrared spectroscopy or ultraviolet spectroscopy. • Mass spectrometry involves molecules being analyzed by their fragmentation patterns, not by their interaction with EM radiation. • The reason the term mass spectroscopy was used is that the fragmentation patterns of the molecules were originally recorded on a photographic plate, whichinvolved electromagnetic radiation. • However, modern mass spectrometers do not use this output method, and so the term mass spectroscopy is no longer correct.
What is Mass Spectrometry? • Measures characteristics of a molecule by converting into ions. • A sample is first ionized (proteins in this case). • Specific ions are separated according to their mass-to-charge ratio (m/z). • Each ion is counted using a detector. • Proteinsare a long sequence of 20 Amino Acids • Ionization removes charged particles from the molecule. • The molecular ion and fragments are formed.
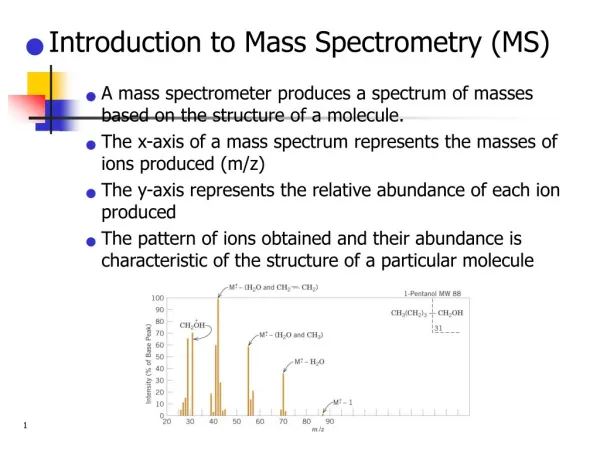
Mass Spectrum • Each “bar” represents an ion with specific m/z and an abundance. • The highest mass ion is the Molecular Ion. • The Base Peak is the most abundant ion, assigned 100%. • All other fragments are percentages of the Base Peak. • y-axis: signal intensity of ions • x-axis: m/z Here are simple examples:
Tandem Mass Spectrometry MS/MS • Multiple steps of Mass Spectrometry selection with some form of fragmentation occurring in between the stages. • Precursor Ion Scan: monitoring for a specific loss from the precursor ion. The first and second mass analyzers can scan across the spectrum as partitioned by a user defined m/z value. The experiment is used to detect specific parts within unknown molecules. • The first scanned is considered the Precursor Ion • The second scanned is considered the Product Ion • Can be performed in either time or space. For our case, we are dealing with time, which utilizes an Ion Trap (counts/second).
The Data Scan 2221 – precursor to 2222
The Data ms/ms fragment scan 2222 of mass 747.48
Brief Bibliography • D. Anastassiou, Genomic Signal Processing, IEEE Signal Processing Magazine, 2001. • “Introduction to Mass Spectrometry,” available at http://www.chem.arizona.edu/massspec/intro_html/intro.html • P.P. Vaidyanathan and Byung-Jun Yoon, The role of signal-processing concepts in genomics and proteomics, Journal of the Franklin Institute, 2004.