Internal documentation and user documentation
UNECE Workshop on Seasonal Adjustment 20 – 23 February 2012, Ankara, Turkey. Internal documentation and user documentation. Anu Peltola Economic Statistics Section, UNECE. Overview. Main types of documentation Internal documentation User documentation Releasing metadata

Internal documentation and user documentation
E N D
Presentation Transcript
UNECE Workshop on Seasonal Adjustment 20 – 23 February 2012, Ankara, Turkey Internal documentation and user documentation Anu Peltola Economic Statistics Section, UNECE
Overview • Main types of documentation • Internal documentation • User documentation • Releasing metadata • Communicate quality issues • Assess and explain revisions • Clear presentation
Main Types of Documentation • Metadata for users • Varying information needs • Documents needed for production • The resulting data itself • At least raw data and seasonally adjusted data to be stored as data vintages • Good for revision analysis
Internal Documentation Internal documentation comprises the following: • Step-by-step working instructions for performing seasonal adjustment • Internal quality reports • Regularly updated lists of national holidays • Lists for monitoring and enumerating the reasons for outliers
Demetra+ • Presents a considerable amount of quality diagnostics • For the key series you may store the results of adjustment at least when re-identifying the model • i.e. The summary statistics of the Results panel • Invest more time on documenting the key time series
Some International Guidelines • The Fundamental Principles of Official Statistics (UNECE, 1992) • The Guidelines for the Modelling of Statistical Data and Metadata (UNECE, 1995) • The ESS Guidelines on Seasonal Adjustment
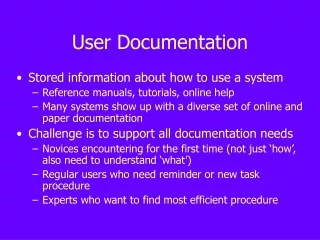
Design User Documentation Well • Due to excess of information • Give only relevant information • Direct the user to more detail (link) • Put emphasis on: 1. Understanding the idea of seasonal adjustment 2. Knowing how to use the data 3. For specialists information for replicating the results • You may use the metadata template of the ESS Guidelines for defining the contents
1. General Explanation Offer metadata for understanding statistics: “Seasonal adjustment is the process of estimating and then removing from a time series influences that are systematic and calendar related. Observed data need to be seasonally adjusted, as seasonal effects can conceal both the true underlying movement in the series as well as certain non-seasonal characteristics which may be of interest to analysts.” - By the Australian Bureau of Statistics
2. How to Use Data? For example, explain reading indices to users: • The name “index” comes from Latin and means a pointer • It allows for comparison in time and space. • A cup of coffee cost 3 Swiss francs in 2011, whereas it was 2.4 francs in 2005 • Here, the year 2005 is our base period. The index number for 2005 is 100, and the comparable figure for 2011 is 125. The result indicates a price increase of 25 per cent.
3. Metadata for Own Seasonal Adjustment • Seasonal adjustment method (e.g.TRAMO/SEATS or X-12-ARIMA) • Software (e.g. Demetra+) • General decision rules applied • Describe the quality of the raw data • Means for outlier detection and correction • Choices in calendar adjustment and national holidays • Set of core quality diagnostics • Timing and reasons for revisions • Contact information to experts
Practices for Dissemination of Metadata - OECD ” All statistical agencies should: • Compile metadata required for users to understand the strengths and limitations of the statistics it describes; and • Keep their metadata up-to-date, incorporating the latest changes in definitions, classifications and methodology, etc. “
Metadata to Accompany Each Release • Ensure an easy access to the metadata • Direct the reader to the more detailed information with a link from releases, tables and graphs + add to printed publications • Lead to a quality report for the indicator • You may offer an archive of historical revisions • Metadata in native and some other languages, such as English
Metadata to Accompany Each Release – UK example • Extracted from the end of a news release: http://www.ons.gov.uk/ons/dcp171778_241735.pdf
What to Say about Data Quality • In general, metadata for the statistical indicator will: • Describe the quality of the raw data (length and appropriateness for adjustment) • Inform about any breaks in the series • Explain the definitions being measured • Limitations of use • Compilation methods and weighting system • Treatment of changes • Departures from international standards • Provide at least a minimum amount of information to enable assessment of reliability
Outliers to be Explained • Outliers stay visible in the adjusted data • They contain information about events • Understanding the causes of outliers helps interpret the data • Inform the user about the criteria for identifying outliers • You may publish a list of events that caused outliers • Explain the difficulty with outliers in the end of the series - duration and type isn't known until new observations accumulate • A permanent level change or just one single peak?
Why Seasonal Adjustment is Revised? Offer an explanation to users, for example: “There are two reasons that we revise seasonal factors: We revise factors when we revise the unadjusted data to achieve a better fit to the revised data.” and “…when future data become available, we use them to obtain improved seasonal factor estimates for the most recent years of the series. These revised factors lead to revised seasonal adjustments of higher quality.” - by the United States Bureau of Economic Analysis
Assess Revisions Before Publishing • Demetra+ includes a revision history test • Use it to assess the likely size of revisions • Look at revisions to changes (previous/corresponding month)
Recommended Metadata for Indices - OECD • Precise definitions of the underlying concepts • Index calculation methods - Laspeyres, Paasche, Fisher • Strategy for constructing indices - fixed base or chain index • Weighting system used, revision practices • Aggregation practices • Re-basing practices - procedures for linking • Treatment of changes
Clear Presentation • Similar but different series should be given different titles • The precise name of the classification used in statistics clearly indicated • When a field of activity is only partially covered it should be clearly indicated for instance with an asterisk or a footnote • Addition: Data corrected after the release could be clearly indicated with an asterisk