
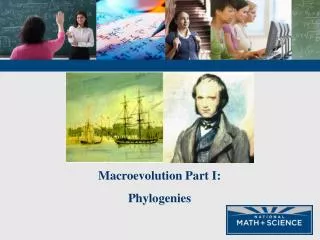
Macroevolution Part I: Phylogenies
Macroevolution Part I: Phylogenies. Taxonomy. Classification originated with Carolus Linnaeus in the 18 th century. Based on structural (outward and inward) similarities Hierarchal scheme, the largest most inclusive grouping is the kingdom level

Macroevolution Part I: Phylogenies
E N D
Presentation Transcript
Macroevolution Part I: Phylogenies
Taxonomy • Classification originated with Carolus Linnaeus in the 18th century. • Based on structural (outward and inward) similarities • Hierarchal scheme, the largest most inclusive grouping is the kingdom level • The most specific grouping is the species level
Taxonomy • A specie’s scientific name is Latin and composed of two names: Genus followed by species • So, the cheetah’s scientific name is Acinonyx jubatus • Taxonomy is the classification of organisms based on shared characteristics.
Domains- A Recent Development • Carl Woese proposed three domains based the rRNA differences prokaryotes and eukaryotes. The prokaryotes were divided into two groups Archaea and Bacteria. • Organisms are grouped from species to domain, the groupings are increasingly more inclusive. • The taxonomic groups from broad to narrow are domain, kingdom, phylum, class, order, family, genus, and species. • A taxonomic unit at any level of hierarchy is called a taxon. • As it turns out, classifying organisms according to their shared characteristics is also indicative of their evolutionary history.
Phylogenetic Trees • Phylogeny is the study of the evolutionary relationships among a group of organisms. • A phylogenetic tree is a construct that represents a branching “tree-like” structure which illustrates the evolutionary relationships of a group of organisms. • Phylogenies are based on • Morphology and the fossil record • Embryology • DNA, RNA, and protein similarities
Phylogenetic Trees Basics • Phylogenies can be illustrated with phylogenetic trees or cladograms. Many biologist use these constructs interchangeably. • A cladogram is used to represent a hypothesis about the evolutionary history of a group of organisms. • A phylogenetic tree represents the “true” evolutionary history of the organism. Quite often the length of the phylogenetic lineage and nodes correspond to the time of divergent events.
Phylogenetic Trees of Sirenia and Proboscidea This phylogenetic tree represents the “true” evolutionary history of elephants. The nodes and length of a phylogenetic lineage indicate the time of divergent events. Also any organism not shown across the top of the page is an extinct species.
Traditional Classification and Phylogenies This phylogenetic tree is a reflection of the Linnaean classification of carnivores, however with the advancements in DNA and protein analysis, changes have been made in the traditional classification of organisms and their phylogeny. For example, birds are now classified as true reptiles.
Taxa A taxon is any group of species designated by name. Example taxa include: kingdoms, classes, etc. Every node should give rise to two lineages. If more than two linages are shown, it indicates an unresolved pattern of divergence or polytomy.
Sister Taxa Sister taxa are groups or organisms that share an immediate common ancestor. Also note the branches can rotate and still represent the same phylogeny.
Rotating Branches The two phylogenetic trees illustrate the same evolutionary relationships. The vertical branches have been rotated.
Definition of a clade • A clade is any taxon that consists of all the evolutionary descendants of a common ancestor • Each different colored rectangle is a true clade.
True Clade • A true clade is a monophyletic group that contains a common ancestor and all of its descendants. • A paraphyletic group is one that has a common ancestor but does not contain all of the descendants. • A polyphyletic group does not have a unique common ancestor for all the descendants.
Anagenesis vs. Cladogenesis • Anagenesis (phyletic change) is the accumulation of changes in one species that leads to speciation over time. • It is the evolution of a whole population. • When certain changes have accumulated, the ancestral population can be considered extinct. A series of such speciation over time constitutes an evolutionary lineage.
Anagenesis vs. Cladogenesis • Cladogenesis- is the budding of one or more new species from a species that continues to exists. • This results in biological diversity. • Usually, cladogenesis involves the physical separation of the group to allow them to evolve separately.
Recreating Phylogenies The formation of the fossil record is illustrated below. Note the location at which fossils are found is indicative of its age which can be used to recreate phylogenies.
Using Homologous Features • Once a group splits into two distinct groups they evolve independently of one another. However, they retain many of the features of their common ancestor. • Any feature shared by two or more species and inherited from a common ancestor are said to be homologous. • Homologous features can be heritable traits, such as anatomical structures, DNA sequences, or similar proteins.
Ancestral vs. Derived Traits • During the course of evolution, traits change. The original shared trait is termed the ancestral trait and the trait found in the newly evolved organism being examined is termed the derived trait. • Any feature shared by two or more species that is inherited from a common ancestor is said to be homologous. The limbs above are homologous structures, having similar bones.
Analogous Structures • Analogous structures are those that are similar in structure but are not inherited from a common ancestor. • While the bones found in the wings of birds and bats are homologous, the wing itself is analogous. The wing structure did not evolve from the same ancestor. The physics necessary for flight is the selection pressure responsible for the similar shape of the wings. Examine airplane wings! Analogous structures should NOT be used in establishing phylogenies .
Why Analogous Structures Exist • Analogous structures evolve as a result of similar selection pressures. These two animals are both burrowing mammals, yet are not closely related. • The top animal is a placental mole and the bottom animal is a southern marsupial mole from Australia. • Both have large claws for digging, thick skin in the nose area for pushing dirt around and an oval body which moves easily through tunnels.
Why Analogous Structures Exist • Another reason analogous structures exists is due to evolutionary reversals. • Fish gave rise to tetrapods. • Cetaceans (whales and dolphins) are tetrapods that returned to the ocean.
Why Analogous Structures Exist • A selection pressure for flippers or fin like structures was exerted for survival in an aquatic environment. • Thus the flipper of a whale or dolphin is very similar to the fin of a fish. • These are analogous structures or homoplasies.
Molecular Clocks Homologous structures are coded by genes with a common origin. These genes may mutate but they still retain some common and ancestral DNA sequences. Genomic sequencing, computer software and systematics are able to identify these molecular homologies. The more closely related two organisms are, the more their DNA sequences will be alike. The colored boxes represent DNA homologies.
Molecular Clocks • The molecular clock hypothesis states: Among closely related species, a given gene usually evolves at reasonably constant rate. • These mutation events can be used to predict times of evolutionary divergence. • Therefore, the protein encoded by the gene accumulates amino acid replacements at a relatively constant rate.
Molecular Clocks • The amino acid replacement for hemoglobin has occurred at a relatively constant rate over 500 million years. • The slope of the line represents the average rate of change in the amino acid sequence of the molecular clock. • Different genes evolve at different rates and there are many other factors that can affect the rate.
Molecular Clocks • Molecular clocks can be used to study genomes that change rather quickly such as the HIV-1 virus (a retrovirus). • Using a molecular clock, it as been estimated that the HIV-1 virus entered the human population in 1960’s and the origin of the virus dates back to the 1930’s.
Reconstructing Phylogenies The following rules apply to reconstructing a phylogeny: Maximum likelihood states that when considering multiple phylogenetic hypotheses, one should take into account the one that reflects the most likely sequence of evolutionary events given certain rules about how DNA changes over time. Maximum parsimony states that says when considering multiple explanations for an observation, one should first investigate the simplest explanation that is consistent with the facts.
Reconstructing Phylogenies • Based on the percentage differences between gene sequences in a human, a mushroom, and a tulip two different cladograms can be constructed. • The sum of the percentages from a point of divergence in a tree equal the percentage differences as listed in the data table.
Reconstructing Phylogenies For example in Tree 1, the human–tulip divergence is 15% + 5% + 20% = 40% In tree 2, the divergence also equals 40% 15% + 25% = 40% BUT, if the genes have evolved at the SAME RATE in the different branches, Tree 1 is more likely since it is the simplest.
Making a Cladogram Based on Traits • Examine the data given. • Propose a cladogram depicting the evolutionary history of the vertebrates. • The lancet is an outgroup which is a group that is closely related to the taxa being examined but is less closely related as evidenced by all those zeros! • The taxa being examined is called the ingroup.
Created by: Carol Leibl Science Content Director National Math and Science


![Microsoft Robotics Developer Studio 고급 프로그래밍 과정 [Part 5] CCR 및 DSS 서비스 프로그래밍](https://cdn3.slideserve.com/5959298/microsoft-robotics-developer-studio-part-5-ccr-dss-dt.jpg)