Download
1 / 25
250 likes | 431 Vues
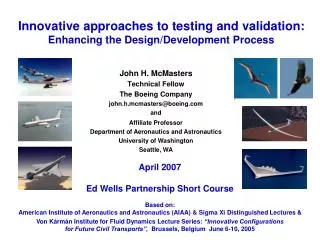
Innovative approaches to testing and validation: Enhancing the Design/Development Process. Affiliate Professor Department of Aeronautics and Astronautics University of Washington Seattle, WA. John H. McMasters Technical Fellow The Boeing Company john.h.mcmasters@boeing.com and.

E N D
Innovative approaches to testing and validation: Enhancing the Design/Development Process Affiliate Professor Department of Aeronautics and Astronautics University of Washington Seattle, WA John H. McMasters Technical Fellow The Boeing Company john.h.mcmasters@boeing.com and April 2007 Ed Wells Partnership Short Course Based on: American Institute of Aeronautics and Astronautics (AIAA) & Sigma Xi Distinguished Lectures & Von Kármán Institute for Fluid Dynamics Lecture Series: “Innovative Configurations for Future Civil Transports”, Brussels, Belgium June 6-10, 2005
A Area (ft.2, m2) a Speed of sound (ft./sec., m/s) AR Aspect ratio, b/č = b2/S b Wing span (ft., m) č Average wing chord (ft.,m) CF Force coefficients (lift, drag, etc.) = F/qS Cℓ Section (2D) lift coefficient CM Moment coefficient = M/qSĉ Cp Pressure coefficient = Δp/q D Drag force (lb., N) E Energy (Ft.-lbs., N-m) e “Oswald efficency factor” ew Wing span efficiency factor (= 1/kw ) F Force (lift, drag, etc.) (lbs., N) H Total head (reservoir pressure) I Moment of inertia kw Wing span efficiency factor (= 1/ew) L Lift force (lb., N) ℓ Length (ft., m) M Mach number (V/a) M Mass (kg) M Moment (ft. lbs., N m) P Power (ft.-lbs./sec., N-m/sec.) p Static pressure (lbs./ft.2) q Dynamic pressure (lbs./ft.2) = ½ρV2 R Range (mi., km) Rn Reynolds number (ρVℓ / μ) S Wing area (ft.2, m2) T Thrust (lb., N) T Temperature (oF) u Local x-direction velocity component V Velocity, Speed (ft./sec., m/s, mph, km/h) v Local y-direction velocity component w Downwash velocity (ft./sec., m/s) ż Sink rate (vertical velocity) (ft./sec., m/s) Greek: α Angle of attack (deg.) Γ Circulation γ Climb or glide angle (deg., rad.) γ Ratio of specific heats in a fluid ε Wing twist angle (deg.) θ Downwash angle (deg.) φ Velocity potential Λ Wing sweep angle (deg.) μ Dynamic viscosity ν Kinematic viscosity (μ/ρ) ρ Fluid mass density (kg/m3) Notation and Symbols Used
Presentation Overview • Case Studies • III. Innovative approaches to testing and validation - Enhancing the Design/Development Process
Case III. Just About Anything Can Be Made to Fly…….. Especially If a Pilot Isn’t Required In It.
Various Wind Tunnel Concept Trade Summary • At a given Mach number (M): • Reynolds number (Rn) = ρVℓ / μ ~ (pT /μ)[mγA/ TT ]1/2 • Model loads (σ) ~ dynamic pressure x model size ~ γ pT A • Power required (P) ~ γ2/3ApT (TT /m)1/2 • where m = molecular weight of test gas • A = cross-sectional area of test section • (A1/2 ~ model characteristic length ℓ) Test Section pT TT Reynolds No. Loads Power required Area (w x h) (atm) oF Rn/Rnbaseσ/σbase P/Pbase A 3 100 1.0 1.0 1.0 4 A 3 100 2.0 4.0 4.0 A 6 100 2.0 2.0 2.0 • Tunnel Option • Baseline • Increase size (x 2) • Increase pressure • Increase size • & pressure • Decrease • temperature • Increase press., • decrease temp. • “Heavy gas” (SF6) • Heavy gas + press. 2.25 A 4 100 2.0 2.0 3.0 A 3 - 120 2.0 1.0 0.78 A 4 - 50 2.0 1.3 1.12 A 3 100 2.4 0.81 0.35 A 5 100 4.0 1.35 0.6
Abstract ** ** at about 4000 ft altitude
Current Wind Tunnel Testing Capability for Commercial Airplane Development NASA NTF (theoretical) 100 Current Boeing Commercial Airplanes Reynolds Number x 10 (Based on wing mean chord) -6 Near Sonic Cruiser B 767 10 NASA Ames 11’x11’ (half model) (full model) BTWT (full model) 1 0 1.0 Mach Number
Aerodynamic Testing • Most airplane development has traditionally relied on wind tunnel and/or • flight testing as an intrinsic part of the process. CFD results still require • validation. • Most of the wind tunnels available for large airplane development are • capable of matching full scale Mach numbers, but fall far short of • matching full scale Reynolds numbers. • Our current suite of wind tunnels are aging and present increasingly • significant limitations when a new design is different in configuration • from those in our established data bases, or cruise at conditions near • Mach 1.0 • Traditional flight testing remains a very expensive complement to, rather • than replacement for, wind tunnel testing. • What alternatives do we have with currently available technology ?
How Much Reynolds Number Is Enough ?? • Attempts to define Reynolds number requirements for a proposed • suite of new Boeing wind tunnels circa 1988-90 failed to establish • definite limits for all anticipated new product developments • The following hierarchy was established, however: • Full scale if possible • High enough to allow straight forward, unambiguous extrapolation to full scale conditions (i.e. high enough to assure that boundary layer conditions and transition locations were similar to those on the full scale airplane - on all critical flight surfaces) • As high as possible within practical tunnel test section size and power requirement limitations (if such levels provided “useable” test data). • The final tunnels proposed would have provided a Reynolds number • capability higher than that of any existing tunnel except the NASA • NTF, but less than that required for reliable stability and control • characteristics extrapolation. The new Boeing tunnels were never • built.
A Possible Alternative to Either Wind Tunnel or Traditional Flight Testing • New Boeing wind tunnels proposed circa 1988-90 required large tests sections, used of up to 5 atmospheres of pressure, and required huge amounts of power to provide about 40-50% full scale Reynolds number on a Boeing 767 class airplane. • Flight testing remained an extremely expensive alternative with severe limits on “safe” test conditions and configuration deviations from those of the basic platform upon which the tests were to be conducted. A casual examination of the tables of a “Standard Atmosphere” then suggested a possible “third option”. This was based on the parallel observation that while a wind tunnel is generally located at approximately standard sea level atmospheric condition, the actual airplane cruises at altitudes well in excess of 30K ft. The third observation was that the power required to fly a “wind tunnel model” at sea level was much less than the power required to blow air around a proper wind tunnel circuit.
Standard Atmosphere Air viscosity varies with temperature. “Hot” air is more viscous than “cold” air. ~36K ft.
A Possible Alternative to Either Wind Tunnel or Traditional Flight Testing Playing with the Standard Atmosphere Reynolds number = Rn = f (gas properties, temp., density) x characteristic length (L) x Mach number ( M) T/T0 Rn/Rn0 M/M0 50 Stratosphere ~36K feet Altitude 1,000 feet Rn/Rn40K 3.2 @ SL 0 Sea level 1.0 0.5 1.5 Speed (V) and Size (L) = constant
A Possible Alternative to Either Wind Tunnel or Traditional Flight Testing Mach number = constant 50 80% Full scale Reynolds number Ref. Full scale cruise condition Flight Altitude 1,000 feet 100% Full scale Reynolds number 1/4 scale model 4 0 0 0.2 0.6 0.8 0.4 Model Scale (Fraction of Full Scale) Note: The numbers get better when the reference cruise altitude increases to 50K feet.
Where to Test? • Need about 200 square miles of open space • Area 51 NV (a favorite) • Glasgow MT • NASA Dryden CA Rocket boost or air drop Recovery device deployed Test data run during coast down to minimum speed Altitude Range Recover Safety Zone Maneuvers as required
Further Considerations While the scheme proposed was developed originally as an alternative to wind tunnel testing for aerodynamic configuration validation, on further reflection it can be seen that more than that is possible. For example, as our technology matures (and becomes more expensive to develop) and the time between major new programs increases dramatically, a major concern for many in our technical community has been the issue of where and how future generations of designers and program managers will get the experience necessary to “be good at” putting together new airplanes when it really matters. The scheme proposed here amounts to building (and flying) a small airplane, but at a cost nearer to that of sophisticated wind tunnel testing program rather than a prototype (manned) airplane development. By extending the objectives of such testing, one may conceive of the “flying model” approach as a means to do significant “process validation”. In this, the configuration validator may be used as a basis for regularly scheduled “process checks” on a larger suite of the analytic/computational tools and methodology to be used in the design of new airplanes. Aeroelastic prediction methodology can be verified, control laws developed, design cycle time reduction strategies tested etc. in a wide array of options. The learning that can come from these “sub-scale, un-manned” airplane development exercises, conducted on a regular basis as part of our on-going R&D efforts, could be of huge value and obtained at an affordable price.
A Recent Japanese Variant A candidate SST configuration to be tested in Australia in July-August 2002. [Note: The first flight attempt was a dramatic boost rocket crash and burn on July 14, 2002.]
No ! “Please Professor McMasters, may I be excused. My brain is full.”