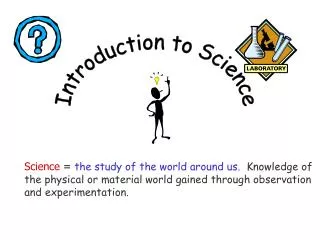
Introduction to Science
Introduction to Science. Chapter 1. The Nature of Science. Scientists try to answer questions about the natural world by: Exploring the unknown Explaining the known Experimenting to test theories or confirm facts. 3 Main Branches of Science.

Introduction to Science
E N D
Presentation Transcript
Introduction to Science Chapter 1
The Nature of Science Scientists try to answer questions about the natural world by: • Exploring the unknown • Explaining the known • Experimenting to test theories or confirm facts
3 Main Branches of Science • Biological- Botany, Ecology, Zoology, etc. • Physical- Physics (motion), Chemistry (matter) • Earth- Geology, Astronomy, Meteorology
The Way Science Works: Scientific Method Used to learn about the natural world; includes the following steps: • Making observations • Asking questions • Forming a hypothesis; making a prediction • Testing the hypothesis through experimentation • Collecting and analyzing data from experiment • Drawing conclusion(s) from data • Communicating data to peers or public
Scientific Method (cont’d) • Only 1 question investigated at a time. • Controlled experiments- compare experimental group (variable) to control group (lacks variable). *independent variable= variable/factor tested *dependent variable= variable measured quantitatively (numbers) • Experiments can only disprove an hypothesis.
Scientific Thinking • Inference= conclusion drawn from previous data, not on direct observation. • Theory= explains why something happens. • Law= describes how something works.
Metric System(based on 10)based on powers of 10 BIGGER SMALLER
Metric Conversions (Only SI units are used to express scientific data) To convert from 1 unit to another: 1. Identify given unit; unknown unit. 2. Use dimensional analysisto compare known tounknown unit (factor-label method) Ex. How many pounds are in 1000 grams?
Know Want Don’t want • How many meters is 800 km?
Organizing Data: Graphs • Line Graph: for continuous data • Bar Graph: compare similar data for several things • Pie Graph: compare parts of a whole Favorite Stores Car Speed Our Ages
Graphing Data • Independent Variable: changed by scientist; x-axis • Dependent Variable: “depends” on independent variable; y-axis Distance (m) Time
How to Make a Line Graph • Label x-axis with dependent variable • Label y-axis with independent variable • Choose increments to represent data on each axis. • Plot points. • Connect points. • Name graph. Distance (m) Time (s)
Scientific Notation • Reduces # of 0’s in very large or small numbers. • Expresses simple #’s x power of 10. (simple #- 1 < number < 10)
Writing Scientific Notation 1. Identify first number between 1 and 10. 2. Place decimal after that number. 3. Count number of places the decimal had to move- this is the exponent of 10. ex. 210,000,000,000,000,000,000,000 m 2.10,000,000,000,000,000,000,000 m (decimal was moved 23 places to the left) sci notation= 2.1 x 10²³
Writing Scientific Notation (cont’d) • If decimal moves to right, exponent is negative (original number is less than 1) • If decimal moves to left, exponent is positive (original number is 1 or greater) ex. 0.0000000902 cm 0x00000009.02cm (decimal was moved 8 places to the right) sci notation = 9.02 x 10⁻⁸ cm
Write 28750.9 in scientific notation. • 2.87509 x 10⁻⁵ • 2.87509 x 10⁻⁴ • 2.87509 x 10⁴ • 2.87509 x 10⁵
Write 2.87509 x 10⁴ in standard notation • 287,509. • 28750.9 • 2875.09 • 28.7509
Calculating Scientific Notation (Follow math rules for powers of 10) *multiplication= add powers of 10 **division= subtract powers of 10 ex. 7.2 x 10⁻⁹ 1.2 x 10² 7.2 x 10⁻⁹ 1.2 x 10² sci notation = 6 x 10 -11
Significant Figures • Number of meaningful digits in a quantity. • Significant figures are: 1. Any # that is not a zero. ex. 1246 (4 SF) 2. Zeros between nonzeros. ex. 1206 (4 SF) 3. Zeros to right of decimal ex. 0.1200 (4 SF)
Significant Figures (cont’d) • Significant figures are not: 1. Zeroes after nonzerosunless a decimal is present. ex. 80,000(1 SF) ex. 83,000(2 SN) ex. 83000.(5 SN) ex. 83.000(5 SN)
Putting It All Together: Chewing Gum • I’ve noticed that when I chew gum, the size changes. • How does the amount of time gum is chewed affect the mass? • Looking through the literature on gum, I see that others have noticed what I’ve noticed, but no one has done an experiment on this.
My hypothesis: I think the gum will get smaller as it gets chewed because the sugar will dissolve. • I create an experiment where I time chewing gum and weighing it at different intervals. • I perform the experiment and collect data • YOU will do this in the lab!