Download

1 / 92
920 likes | 1.31k Vues
Lecture 3 How Real is Global Warming?. Will Human-Induced Climate Change Destroy the World?. Global Warming. Global warming is the increase in the average measured temperature of the Earth's near-surface air and oceans since the mid-20 th century, and its projected continuation.

E N D
Lecture 3 How Real is Global Warming? Will Human-Induced Climate Change Destroy the World?
Global Warming • Global warming is the increase in the average measured temperature of the Earth's near-surface air and oceans since the mid-20th century, and its projected continuation. • The average global air temperature near the Earth's surface increased 0.74 ± 0.18 °C (1.33 ± 0.32 °F) during the 100 years ending in 2005. Source: Intergovernmental Panel on Climate Change
? Temperatures over last 140 years • Global average temperature has risen by approximately 1ºF over the last century
“Hockey Stick” Controversy 0.6 Direct temperature measurements Mann et al. 1999 0.4 0.2 0 Temperature Change (°C) -0.2 -0.4 -0.6 -0.8 1000 1200 1400 1600 1800 2000 Year Mann,1998,1999
The map shows the 10-year average (2000-2009) global mean temperature anomaly relative to the 1951-1980 mean.
Global Climate History Geologic evidence clearly indicates relative long-term climate stability that has allowed liquid H2O to exist for most of geologic history Tectonics plays an important role in regulating atmospheric CO2 and therefore climate
Human activities have changed the composition of the atmosphere since the pre- industrial era Indicators of the human influence on the atmosphere (IPCC, 2001).
McIntyre, S., and R. McKitrick (2003), Corrections to the Mann et al. (1998) proxy data base and Northern Hemispheric average temperature series, Energy Environ., 14, 751–771. McIntyre, S., and R. McKitrick (2005), Hockey sticks, principal components, and spurious significance, Geophys. Res. Lett., 32, L03710, doi:10.1029/2004GL021750.
Martin Durkin,The Great Global Warming Swindle:2007 1﹑大气运动是个很复杂的过程,太阳﹑洋流﹑宇宙射线都会参与其中,怎么能简单地都怪罪于二氧化碳呢﹖ 2﹑二氧化碳只是地球大气很小的组成部分,而且这么小部分的气体增加,有多少是人引起的也很难说。3﹑温度和二氧化碳的相关曲线和人类发展的进程曲线不符,人类工业高速发展发生在1970年代,但是温度急速增长却在1940年代。4﹑温度和二氧化碳的相互关系更像是因为气温上升了,二氧化碳总量跟着增加,可否解释为:因为海洋本身能存储二氧化碳,如果温度升高肯定会有二氧化碳从裡面释放出来﹖ 5﹑温室气体最主要的是水蒸气。6﹑一万年内就有过两次大的温暖期,一次在14世纪,一次在大禹治水时期,这如何解释﹖ 7﹑新能源(太阳能﹑风能)成本高昂而且不稳定,因此造成的损失谁来负责﹖这影响了很多发展中国家的发展。8﹑现在大量的研究经费用于研究全球变暖的影响和预测,但是有多少经费是给这些反对全球变暖的科学家进行研究的呢﹖ 9﹑历史上就曾经有过格陵兰冰架完全融化的事情,是否有此事﹖ 10﹑全球变暖的重要证据 —“曲棍球棒”气温曲线在科学界到底有没有可信度﹖
“曲棍球门” • “气候门” • “冰川门” • “亚马逊门”
逻辑链条貌似严谨:人类排放二氧化碳→大气中温室气体增加→温室效应更加显著→地球气温升高→冰川融化、海平面上升以及一系列灾难性气候接踵而至→人类面临生存危机。仿佛一切顺理成章,人类在毁灭地球
路线图 • 1988年,欧洲人推动下IPCC成立,开始谋划应对“暖化危机”; • 1990年,欧共体代表在“第二次世界气候大会部长级会议”中,首次提出保护大气层和控制二氧化碳排放的主张,并提议立即开始关于“气候变化公约”的谈判,从而拉开《气候变化框架公约》谈判的序幕; • 1992各国首脑奔赴巴西里约热内卢,签订《联合国气候变化框架公约》,开始把矛头对准二氧化碳,但没有具体规定各国承担义务; • 1995年3月28日,公约第一次缔约方大会在德国柏林召开;
哥本哈根大会,全称《联合国气候变化框架公约》第15次缔约方会议暨《京都议定书》第5次缔约方会议,于2009年12月7-18日在丹麦首都哥本哈根召开。来自192个国家的谈判代表召开峰会,商讨《京都议定书》一期承诺到期后的后续方案,即2012年至2020年的全球减排协议。哥本哈根大会,全称《联合国气候变化框架公约》第15次缔约方会议暨《京都议定书》第5次缔约方会议,于2009年12月7-18日在丹麦首都哥本哈根召开。来自192个国家的谈判代表召开峰会,商讨《京都议定书》一期承诺到期后的后续方案,即2012年至2020年的全球减排协议。 • 以碳排权为主题
1997年12月11日,第三次缔约方大会在日本东京召开,149个国家和地区签署通过了《京都议定书》,开始明确发达国家碳排放量;1997年12月11日,第三次缔约方大会在日本东京召开,149个国家和地区签署通过了《京都议定书》,开始明确发达国家碳排放量; • 2007年12月,第十三次缔约方大会在印度尼西亚的巴厘岛召开,协商“后京都”问题,即《京都议定书》到期后的进一步减排事项,会议通过“巴厘路线图”; • 2008年8月,西方G8领导人会议上就温室气体减排长远目标达成一致意见,八国领导人在一项声明中说,八国将与《气候框架公约》其他缔约国共同实现2050年温室气体至少减半的长期目标,在相关缔约方谈判中与其他国家讨论并通过
Topics to be covered • Is the world getting warmer? • If so, are the actions of mankind to blame for earth’s temperature increases? • What can/should be done about these issues? • Are the potential resolutions worth the costs to implement them?
What the unconvinced people are saying… • “Theory remains entirely unproved.” • “One-in-three chance … that experts are wrong.” • “Models are incapable of handling … water vapor.” • “Troposphere should be warming faster than the surface.” • “If the weather folk can’t figure out what’s happening • for the rest of the week, how can they tell us what the climate will be for the next 50 years?” • 6. “Guess what? Antarctica’s getting colder, not warmer.” • 7. “Global warming is still just a theory.”
Facts… • Global mean temperature has been going up in the last 140 years • The magnitude of this variability does not exceed natural variability • Concentration of carbon dioxide has been going up as well as other greenhouse gases • Radiative theory of atmospheric gases (greenhouse) and aerosols is important • Climate change involves the entire “earth system” not just the atmosphere • 6. Future projections face uncertainties in emission production, modeling, and impacts • 7. Several thousand scientists from 40+ countries all over the world have been involved
Challenges • A. Nature of climate system • 1. Analysis must consider entire climate system and all of humanity • 2. Extensive natural climate variability • 3. Global connections for both climate forcing and climatic response • 4. Uncertainties in outcomes involve uncertainties in many components • 5. A small change in global means can translate to large changes in • local means/extremes • B. Needs for research • 1. Improve data – longer data, error analysis, more global coverage • 2. Improve theory – radiation-aerosol, cloud drops-aerosol(气溶胶 ) • 3. Improve models – parameterization for small scale components • 4. Separating naturally-induced fluctuations from human effects • C. Nature of people • 1. Implement controls on human impacts on the environment • 2. World cooperation • 3. Look at ourselves
Paleo-Climate • Climate is the mean stateof the environment, long-term average of daily variations • “Climate change” depends on the resolution of the proxies and the length of the “mean state” in consideration
Climate Change Events • Tectonic scale (Millions of years ago) • Orbital Scale, when Milankovich started showing up (3 Ma) • Deglacial and Millennial Scale • Historical climate changes
Time line • 600-750 Ma: Snowball Earth (Neoproterozoic) • 300 Ma-5Ma: Hot house world (Mesozoic/Cenozoic ) • 3 Myr-present: Orbital-scale variability: series of glaciation and retreat • 20 Kyr: Last glacial maximum (LGM) • ~13 Kyr:Bolling/Allerod warming • ~12 Kyr: Younger Dryas (YD) • Heinrich events and D-O cycles; • 1000-1300 BP: Medieval Warm Period • 1400-1800 BP: Little Ice Age
History of Earth’s Climate • Life appeared ~3.8 billion years ago • Photosynthesis began 3.5-2.5 billion years ago • Produced oxygen and removed carbon dioxide and methane (greenhouse gases) • Earth went through periods of cooling (“Snowball Earth”) and warming • Earth began cycles of glacial and interglacial periods ~3 million years ago
Nitrogen (N2) Oxygen (O2) Water (H2O) Carbon Dioxide (CO2) Methane (CH4) Earth’s Atmospheric Gases Non-Greenhouse Gases 99% Greenhouse Gases 1%
Sun Venus Runaway Greenhouse Effect • 97% carbon dioxide • 3% nitrogen • Water & sulfuric acid clouds • Temperature:860°F
Carbon Dioxide Levels Muana Loa Readings CO2 Levels Since 1958 370 350 CO2 (ppm) 330 310 40 30 20 10 0 420 370 320 CO2 (ppm) 270 220 Dome Concordia Vostok Ice Core 170 600000 400000 200000 0 Time (YBP)
Worldwide Carbon Emissions Total Liquid fuel Solid fuel Gas fuel 8 7 6 5 Carbon (109 metric tons) 4 3 2 1 0 1750 1800 1850 1900 1950 2000 Year
Annual Carbon Emissions Annual carbon emissions Atmospheric CO2 Atmospheric CO2 average 8 6 Carbon (109 metric tons) 4 2 0 1955 1965 1975 1985 1995 2005 Year
Future Carbon Dioxide Levels • Increasing CO2 emissions, especially in China and developing countries • Likely to double within 150 years: • Increased coal usage • Increased natural gas usage • Decreased petroleum usage (increased cost and decreasing supply)
Kyoto Protocol • Adopted in 1997 • Cut CO2 emissions by 5% from 1990 levels for 2008-2012 • Symbolic only, since cuts will not significantly impact global warming
How to study paleoclimate? Marine • Ocean sediment cores (more regional) Terrestrial (more local) • Lakes and wetlands cores • Tree ring/Coral (growth response) • Ice cores • Speleothem • Ice cores • Sedimentary rocks/uplifted sediments
Uses of proxy records of climate depend on both • - time span of record • - resolution of record
Proxies that record annual growth patterns can indicate year to year variations in climate • -tree rings • -ice cores • -deep lake sediments • -coral reefs • Limited to last 500-1000 years except ice cores
three cores (taken from three trees growing in El Malpais National Monument in New Mexico) have ring patterns in common. For example… 1816 Year Without a Summer wide ring 1793 = wide ring with thick latewood 1847 = verynarrow ring 1806 = narrow ring (absent on bottom) 1840 = wide ring
Corals: The geologic record of El Niño Living Porites corals provide records for the last 200 years CORALS from the tropical Pacific record El Niño’s in the geochemistry of their skeletons Fossil Porites corals enable us to extend the record back many centuries
Overlapping fossil corals: ancient El Niño events Good reproducibility between coral geochemical records increases confidence in coral climate reconstructions.
Varved Lake Sediments • Study site was an alpine lake in Ecuador 75 km east of the Pacific Ocean and east of the continental divide • During moderate to severe El Ninos bursts of torrential rainfall deposit layers of mainly inorganic sediment (light-colored material in these cores) • These flood deposits are less frequent before 5000 year ago
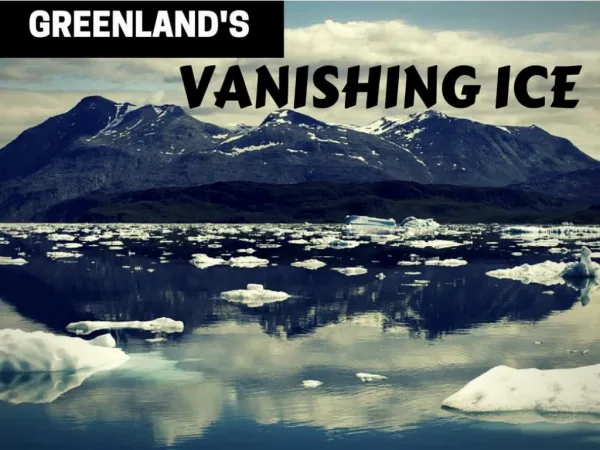
Glaciers as records of climate • Ice cores: • Detailed records of temperature, precipitation, volcanic eruptions • Go back hundred of thousands years
Proxies: plant and animal remains • Pollens, forams • Molecular techniques (transformation of molecules at a specific condition, or specific remains of group of living organism).i.e. alkenones(长链烯酮 ), lignin(木质素 ) • Each species has a specific range of habitat (precip, T, soil type, nutrients, salinity) i.e. found foram in freshwater wetland cores: must have been saltier, Tropic pollen in the arctic = warmer