Download
1 / 1
10 likes | 142 Vues
Analysis of Ecosystem as a Network of Environments David K. Gattie 1 , John R. Schramski 2 , Stuart R. Borrett 2,3 , Bernard C. Patten 1, 2 , H. Jeff Turk 1 , and Stuart J. Whipple 3

E N D
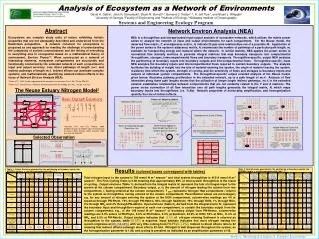
Analysis of Ecosystem as a Network of Environments David K. Gattie1, John R. Schramski2, Stuart R. Borrett2,3, Bernard C. Patten1, 2, H. Jeff Turk1, and Stuart J. Whipple3 University of Georgia 1Faculty of Engineering and 2Institute of Ecology; 3Skidaway Institute of Oceanography Systems and Engineering Ecology Program Abstract Ecosystems are complex study units of nature exhibiting holistic properties that are not adequately described and understood from the Newtonian perspective. A network construct for ecosystems is proposed as one approach for meeting the challenge of understanding the complexity of system connectedness and the linking of everything to everything else in ecosystems based on a mathematical theory of environment, Environ Theory1,2. When constructed as a network of interacting elements, ecosystem compartments are structurally and functionally connected by the extended network of each compartment’s input and output environs, over direct pathways of length m=1, and indirect pathways of length m>1. Indirect effects can dominate complex systems, and mathematically quantifying network indirect effects is the focus of Network Environ Analysis(NEA). 1Patten, B.C. 1978. Systems approach to the concept of environment, Ohio J. Sci, 78, pp. 206-222. 2Patten, B.C. 1978 Environs: relativistic elementary particles for ecology, Am. Nat., 119, pp. 179-219. Network Environ Analysis (NEA) NEA is a throughflow and storage based input-output analysis of ecosystem networks, which utilizes the matrix power series to analyze the network of input and output environments for each compartment. For the Neuse model, the observed flow matrix, F, and adjacency matrix, A, indicate 22 pair-wise relationships out of a possible 42. Application of the power series to the system’s adjacency matrix, A, enumerates the number of pathways of a particular path length, m, available for transporting energy and material within the network. In similar fashion, NEA applies the power series to normalized flow intensity matrices to generate integral matrices that map boundary transports into compartmental throughflows, storages, intercompartmental flows and boundary transports. Throughflow-specific, output NEA analyzes the partitioning of boundary inputs into boundary outputs and intercompartmental flows. Throughflow-specific, input NEA analyzes the boundary inputs and intercompartmental flows required to sustain boundary outputs. The analysis facilitates the building of insight into the fate of material entering the system, the origin of material leaving the system, residence time within the system, strength of cycling, and the sensitivity of flows and storages to boundary inputs and outputs at individual system compartments. The throughflow-specific output oriented analysis of the Neuse model, given below, illustrates pathway proliferation in the extended network, up to a path length of m=4. Analysis of flow intensities along these path lengths shows that the utilization of longer length indirect pathways, m>1, in the extended network establishes relationships between compartments that are not evidently related in the F and A matrices. The power series summation of all flow intensities over all path lengths generates the integral matrix, N, which maps boundary inputs into throughflows: (i.e. T=Nz). Network properties of nonlocality, amplification, and homogenization quantify the role of indirect effects. The Neuse Estuary Nitrogen Model2 Basic Digraph Equations 2Christian, R.R., and C.R. Thomas. 2003. Network analysis of nitrogen inputs and cycling in the Neuse River Estuary, North Carolina, USA. Estuaries 26:815-828. Selected Observation Results (colored boxes correspond with tables) Total nitrogen input to the system is 795 mmol N m-2 season-1 and total system throughflow is 41514 mmol N m-2 season-1. The Finn Cycling Index is 0.89 meaning that approximately 89% of total system throughflow is the result of cycling. Output environs (Table 1), derived from the integral matrix N, represent the fate of nitrogen input to the system at the column compartment. Boundary output, yi, is the amount of nitrogen leaving the system from row compartment, i, having entered at the column compartment. T INT,i represents nitrogen that compartment i returns to the system as throughflow, having entered at the column compartment. Parenthetical values are percentages; e.g. for any amount of nitrogen entering the system at the DON compartment, column-wise readings are 4% is exported through PN-Phyto, 19% through PN-Hetero, 50% through Sediment, 19% through DON, 1% through NOx, 3% through NH4, and 4% through PN-Abiotic. Input environs (Table 2), derived from the integral matrix N’, represent the boundary input and throughflow required at each row compartment, to sustain the boundary output from the column compartment; e.g., of the 148 mmol N m-2 season-1 of boundary output from PN-Hetero, column-wise readings are 2.0% enters at PN-Phyto, 3.0% at PN-Hetero, 2.0% at Sediment, 23.0% at DON, 53% at NOx, 11.0% at NH4, and 5.0% at PN-Abiotic. Output analysis indicates that ~2.0% of nitrogen entering Sediment is returned as throughflow to the system, while 50-68% is exported. Input analysis indicates that most nitrogen leaving the system originates at NOx (50-65%), with very little coming from PN-Phyto (~2%). Indirect to direct effects ratio is 52 meaning that indirect effects outweigh direct effects 52-fold. Nitrogen is well dispersed throughout the system, as the homogenization parameter is 1.88, and cycling is prevalent as indicated by an amplification parameter of 42. Table 2. Input Environs generated by the partitioning of boundary outputs into boundary inputs, yi, and intercompartmental flows, T INT,i Table 1. Output Environs generated by the partitioning of boundary inputs into boundary outputs, yi, and intercompartmental flows, T INT,i Session: Modeling & Analysis of Complex Ecosystems


