Impact of Sclerostin on Cell Numbers and Caspase Activity Post-Transduction
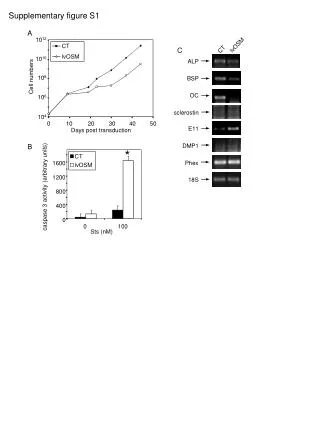
This supplementary figure (S1) presents data on the effects of sclerostin and lvOSM transduction on cell numbers and caspase-3 activity over time. Measurements were taken at various days post-transduction, focusing on the interaction of DMP1 and Phex in relation to sclerostin levels. Results are expressed in arbitrary units, highlighting the cellular responses to different concentrations of Sts (nM). This analysis contributes essential insights into osteocyte biology and the role of sclerostin in bone metabolism.

Impact of Sclerostin on Cell Numbers and Caspase Activity Post-Transduction
E N D
Presentation Transcript
CT lvOSM Supplementary figure S1 A 1012 lvOSM CT C 1010 ALP Cell numbers BSP 108 OC 106 sclerostin 104 0 10 20 30 40 50 Days post transduction B E11 * DMP1 1600 1200 Phex caspase 3 activity (arbitrary units) 800 18S 400 0 0 100 Sts (nM) CT lvOSM