Download
1 / 43
430 likes | 633 Vues
Effects of Poverty, Funding Structure and Scale on Public School System Performance John Mackenzie FREC/CANR, University of Delaware May, 2010. BACKGROUND: Coleman Report (1966): finds link between money and school performance to be tentative at best. (Basic problem: lack of data!)

E N D
Effects of Poverty, Funding Structure and Scale on Public School System PerformanceJohn MackenzieFREC/CANR, University of DelawareMay, 2010
BACKGROUND: Coleman Report (1966): finds link between money and school performance to be tentative at best. (Basic problem: lack of data!) Eric Hanushek (1981,1986,1997): “Throwing Money at Public Schools” meta-analyses of studies relating funding to school performance. (Methodological error in counting studies as datapoints:7 heads in 10 coin tosses does not prove a coin is biased, but combining 100 trials of 10 tosses and getting 7 or more heads in 60% of the trials does.) Jay Greene (Manhattan Institute): Real per-pupil spending “almost doubled” from 1972 to 2002, while NAEP scores did not improve much at all.(So what? Real per-capita disposable incomes “almost doubled” too. Compare rising costs of college!)
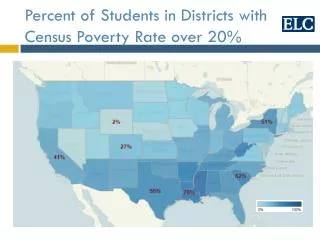
Public schools today are…more inclusive of minorities, immigrants, etc.;offer a broad array of non-traditional services;serve an expanded population of poor children;deliver more remedial & special education.Education is typically a “luxury” good: as incomes rise, households invest larger proportions of their incomes in education. Education confers status; may be a positional good.US income inequality continues to increase, and the relative economic return to a HS diploma is falling. If education lifts families from poverty for multiple generations, is residual poverty becoming more intractable? Does the rising real cost of public schools simply reflect the rising marginal cost of eliminating poverty?
NAÏVE UNIVARIATE MODELS [t-statistics in brackets] SAT02 = 1187.16 –0.0156*TXPP02 {25.70] [-2.59] N=50; R-square=0.123SAT03 = 1185.38 –0.0143*TXPP03 [26.06] [-2.51] N=50; R-square=0.116SAT04 = 1181.65 –0.0131*TXPP04 {26.85] [-2.49] N=50; R-square=0.114 SAT05 = 1196.88 –0.0117*TXPP05 [28.45] [-2.87] N=50; R-square=0.146
Those kids get dumber every year, Jill! Is my hair OK? They sure do, Bob! More waste and bloat in public education? School spending rises and SAT scores fall!
A textbook example of an omitted variable problem: REGRESSION MODELS CONTROLLING FOR PARTICIPATIONSAT02 = 1062.5 + 0.0135*TXPP02 – 244.58*Partic02 [43.29] [3.46] [-12.82] N=50; R-square=0.806SAT03 = 1074.5 + 0.0113*TXPP03 – 234.60*Partic03 [43.29] [3.46] [-12.82] N=50; R-square=0.809SAT04 = 1079.4 + 0.0104*TXPP04 - 230.50*Partic04 [48.65] [3.37] [-13.00] N=50; R-square=0.807SAT05 = 1095.9 + 0.0070*TXPP05 - 221.17*Partic05 [46.60] [2.63] [-11.47] N=50; R-square=0.775
ECONOMETRIC DIGRESSIONA formal treatment of the participation bias problem: When only high-performing students take the SAT the mean score is biased upward. Expanding participation to include more typical students educes the bias.
Low SAT participation boosts the mean scores of low-performing states above the mean scores of high-performing states.
Lambda = NORMDIST(PredY,0,1,FALSE)/(1-NORMDIST(PredY,0,1,TRUE)) = f(X)/[1-F(X)] where f and F are standard normal density and distribution
Incorporate LAMBDA as participation bias correction instrument:
Or construct the bias correction instrument directly from the observed participation rates:
“50 experiments in public school system finance and structure” Data Sources:US Census Bureau, Public Elementary–Secondary Education Finance Data (annual State-level tables)http://www.census.gov/govs/schoolUS Dept. of Education, 2003, 3005, 2007 and 2009National Assessments of Education Progress (NAEP)http://nces.ed.gov/nationsreportcard/statecomparisons/
AK LA
VT HI
MA NJ CT PA NY
2009 NAEP 4th grade MATH
2009 NAEP 8th grade MATH
2009 NAEP 4th grade READING
2009 NAEP 8th grade READING
State funding replacing property tax Targeted Federal dollars (Title I, etc.) Larger average district size in higher-poverty states Less reliance on property taxes in larger districts Less reliance on local funding in higher-poverty states
Similar results are obtained with 2007, 2005 and 2003 NAEP scores analyzed against contemporaneous or lagged funding, average district size, poverty, etc.(These are large, slowly-evolving systems)Poverty is the strongest predictor of NAEP performance, but is collinear with federal funding (+), local funding (-) and average district size (+).Structural Variables: Federal funding is mainly targeted to low-performing populations—Title I and special needs. State funding does not drive NAEP performance much at all.Local funding drives NAEP performance most efficiently. Average district size is negatively correlated with NAEP performance, suggesting scale diseconomies.
Implications of funding and average district size:HI, FL*, MD*, NV, UT, NC, LA: large average district size, generally more state funding, lower NAEP scoresVT*, MT, ND, ME, SD, NE, OK, NH: many small districts, generally more local funding, higher NAEP scoresLikely sources of public dissatisfaction with schools:Displacement of local funding with state funding, and consequent loss of local control.Legacy of desegregation, Serrano, consolidation, bureaucratization, political intervention and accumulation of regulation, union protection of teacher seniority, etc.
These results suggest the efficiency of public education can be improved by restoring local autonomy of school systems. Why would local dollars drive school system performance more efficiently than state dollars?Local funding implies stronger local governance and accountability.