Download
1 / 29
290 likes | 442 Vues
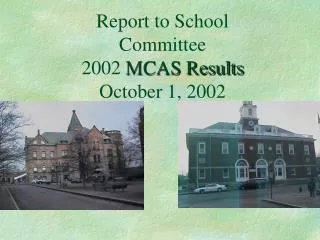
Report to School Committee 2003 MCAS Results October 21, 2003. A New Baseline. New Baseline. Changes in the Testing Program Results by Performance Category for the District and Individual Schools Comparable Communities Next Steps. Changes in Testing Program. No Average Scaled Scores

E N D
Report to School Committee2003 MCAS ResultsOctober 21, 2003 A New Baseline
New Baseline Changes in the Testing Program Results by Performance Category for the District and Individual Schools Comparable Communities Next Steps
Changes in Testing Program No Average Scaled Scores New Testing Requirement for LEP Students BHS tested 102 LEP students, 81 of whom would have been previously exempt! EJH tested 148 LEP students, 127 of whom would have been previously exempt! There were 164 students in grades 3, 4, & 6 who would have been previously exempt!
MCAS Testing Program High Stakes/High Standards Grades tested: 3, 4, 6, 7, 8, and 10 Tonight’s focus: English/Language Arts Mathematics
Performance Categories Category Advanced Proficient Needs Improvement Failing/Warning Score Range 260-280 240-259 [240 = proficient] 220-239 [220 = passing] 200-219
MCAS 2003 Changes in Performance Categories by Grade
Percentage of Students in Warning/Failing Category ELA MATH year 98 99 00 01 02 0398 99 00 01 02 03 Grade 3 14 14 15 [13] State 7 6 7 Grade 4 29 25 22 19 19 18 [15] 39 35 29 27 35 28 [26] State 15 12 16 11 10 10 23 19 18 19 19 16 Grade 6 46 39 37 [36] State 33 30 26 Grade 7 24 19 15 [13] State 12 9 7 Grade 8 69 67 67 48 54 59 [57] State 42 40 39 31 33 33 Grade 10 44 42 42 24 14 19 [14] 76 76 64 35 38 36 [33] BHS 44 41 41 23 13 18 [13] 75 76 64 34 36 35 [32]State 28 32 34 18 14 12 52 53 45 25 25 21
Percentage of Students in Advanced /Proficient Category ELA MATH year 98 99 00 01 02 0398 99 00 01 02 03 Grade 3 36 42 42 [44] State 62 67 63 Grade 4 6 8 8 33 32 38 [40] 17 18 23 23 20 22 [23] State 20 21 49 51 54 55 34 36 40 34 39 40 Grade 6 23 29 27 [27] State 36 41 42 Grade 7 31 38 36 [37] State55 6465 Grade 8 14 8 12 18 14 13 [14] State 31 28 34 34 34 37 Grade 10 22 24 27 42 61 52 [57] 7 9 16 29 27 33 [36] BHS 22 24 27 43 63 54 [59] 7 9 16 30 29 34 [37] State 38 34 36 51 59 61 24 24 33 45 44 51
Individual School Results Changes in Performance Categories
Grade 3 Percentage of students in warning category ELA year 01 02 03 Angelo 13 19 25 [17] 16% Arnone 18 21 16 [14] 29% Ashfield 3 9 5 Belmont St. 13 11 11 [ 3] 18% Brookfield 7 6 6 Davis 21 22 16 [14] 15% Downey 22 16 25 Franklin 10 11 11 Gilmore 11 18 16 [12] 28% Hancock 7 10 10 Huntington 11 8 13 Kennedy 8 10 13 [4] 15% Plouffe 28 19 5 Raymond 18 17 27 Whitman 6 0 5 LEP
Grade 3 Percentage of students in adv/prof category ELA year 01 02 03 Angelo 29 36 37 [43] 16% Arnone 34 40 35 [39] 29% Ashfield 41 46 45 Belmont St. 26 42 51 [61] 18% Brookfield 41 55 62 Davis 26 28 38 [40] 15% Downey 33 47 37 Franklin 48 40 57 Gilmore 38 36 20 [21] 28% Hancock 52 53 53 Huntington 37 35 36 Kennedy 37 54 46 [52] 15% Plouffe 36 33 62 Raymond 36 44 28 Whitman 29 37 38 LEP
Grade 4 Percentage of students in warning category ELA MATH year 98 99 00 01 02 0398 99 00 01 02 03 Angelo 6% 23 17 15 16 20 11 [9] 50 23 25 24 39 19 [17] Arnone 17% 43 31 29 14 22 26 [19] 53 46 35 22 33 32 [30] Ashfield 40 13 18 15 9 14 46 14 16 15 27 15 Belmont St. 33% 18 31 33 21 22 25 [18] 42 42 36 23 37 47 [42] Brookfield 26 33 12 18 12 8 34 48 21 27 30 11 Davis 13% 36 33 34 28 31 24 [23] 53 49 46 53 54 26 [25] Downey 27 30 40 32 37 21 25 43 41 40 52 36 Franklin 35 35 15 9 13 6 37 49 22 11 31 17 Gilmore 22% 39 29 26 21 11 42 [35] 49 44 26 26 27 56 [47] Hancock 19 15 10 7 18 17 14 19 17 17 31 25 Huntington 24 13 21 14 5 5 27 17 25 22 24 25 Kennedy 24% 9 7 15 18 10 21 [ 9] 12 21 26 20 20 27 [16] Plouffe 47 25 18 24 28 9 63 38 28 36 37 28 Raymond 27 30 22 24 23 15 48 37 39 30 36 32 Whitman 22 19 16 24 7 4 63 38 26 31 18 8 LEP
Grade 4 Percentage of students in adv/prof category ELA MATH year 98 99 00 01 02 0398 99 00 01 02 03 Angelo 6% 8 27 18 52 38 54 [56] 10 41 42 39 29 40 [41] Arnone 17% 12 9 8 44 39 39 [43] 20 12 23 36 27 18 [20] Ashfield 1 5 5 27 33 40 16 28 16 31 23 26 Belmont St. 33% 3 6 4 30 34 23 [25] 16 12 10 13 12 10 [11] Brookfield 4 2 5 28 19 40 19 7 23 16 13 34 Davis 13% 5 1 3 19 13 31 [32] 11 8 10 11 8 14 [14] Downey 2 4 2 18 12 30 19 10 14 13 11 23 Franklin 0 2 2 40 35 52 6 11 28 35 24 27 Gilmore 22% 8 2 4 15 46 13 [16] 18 3 18 8 29 6 [ 8] Hancock 8 11 10 50 26 36 29 32 29 23 19 20 Huntington 12 7 8 35 40 40 23 25 32 29 24 15 Kennedy 24% 15 15 19 43 54 51 [59] 36 27 33 23 32 32 [38] Plouffe 0 19 13 35 36 40 2 21 26 28 30 25 Raymond 4 3 4 23 26 37 5 10 14 17 17 12 Whitman 0 7 8 26 46 62 13 9 28 21 28 32 LEP
Grade 6 Percentage of students in warning category MATH year 01 02 03 Angelo 47 40 33 [32] 7% Arnone 33 30 33 [30] 11% Ashfield 54 48 29 Belmont St. 59 31 45 [41] 18% Brookfield 45 28 32 Davis 73 66 52 Downey 46 38 34 Franklin 35 25 26 Gilmore 52 39 53 [49] 21% Hancock 30 29 19 Huntington 46 41 44 Kennedy 33 25 40 [31] 16% Plouffe 54 50 43 Raymond 53 50 42 Whitman 27 29 25 LEP
Grade 6 Percentage of students in adv/prof category MATH year 01 02 03 Angelo 28 39 46 [48] 7% Arnone 32 42 39 [43] 11% Ashfield 18 18 21 Belmont St. 18 28 14 [16] 18% Brookfield 20 38 17 Davis 5 8 14 Downey 22 25 32 Franklin 28 50 51 Gilmore 10 23 11 [ 9] 21% Hancock 37 30 33 Huntington 23 21 15 Kennedy 32 52 27 [31] 16% Plouffe 23 25 30 Raymond 12 15 21 Whitman 27 41 34 LEP
Grade 7 Percentage of students in warning category ELA year 01 02 03 North 24 13 7 South 26 18 13 East 23 26 27 [11] 20% West 20 14 11 LEP
Grade 7 Percentage of students in adv/prof category ELA year 01 02 03 North 24 39 39 South 30 36 36 East 34 28 27 [35] 20% West3648 43 LEP
Grade 8 Percentage of Students in Warning Category MATH year 98 99 00 01 02 03 NJH 73 73 63 44 49 54 SJH 68 64 64 50 54 58 EJH 72 69 71 52 52 65 [58] 21% WJH 63 60 65 41 59 53 LEP
Grade 8 Percentage of Students in Adv/Prof Category MATH year 98 99 00 01 02 03 NJH 10 5 13 21 17 16 SJH 12 11 11 16 13 15 EJH 12 6 10 15 12 9 [11] 21% WJH 18 10 15 22 15 16 LEP
Grade 10 Percentage of Students in Failing Category ELA year 98 99 00 01 02 03 BHS 44 41 41 23 13 18 [13] 8% MATH year 98 99 00 01 02 03 BHS 75 76 64 34 36 35 [32] 8% LEP
Grade 10 Percentage of Students in Adv/Prof Category ELA year 98 99 00 01 02 03 BHS 22 24 27 43 63 54 [59] 8% MATH year 98 99 00 01 02 03 BHS 7 9 16 30 2934 [37]8% LEP
Percent of All Students in Warn/Fail Category Grade 3 4 7 10 4 6 8 10 ELA ELA ELA ELAMath Math Math Math Brockton 15 18 15 20 28 37 59 37 Boston 21 28 16 30 38 50 53 36 Chelsea 11 20 17 41 20 43 64 53 Chicopee 10 15 15 15 25 48 51 28 Fall River 8 13 13 24 22 51 68 50 Holyoke 28 36 30 40 42 63 77 55 Lawrence 27 35 25 37 52 64 72 53 Lowell 19 25 15 22 33 51 57 36 Lynn 11 16 10 21 25 37 52 33 New Bedford 9 15 18 27 24 41 62 42 Pittsfield 6 8 13 12 17 49 44 24 Revere 7 15 12 20 19 25 49 32 Springfield 17 22 23 34 34 62 72 53 Taunton 6 9 9 14 13 31 52 27 Worcester 10 14 19 24 21 34 60 38
Percent of All Students in Adv/Prof Category Grade 3 4 7 10 4 6 8 10 ELA ELA ELA ELAMath Math Math Math Brockton 42 38 36 52 22 27 13 33 Boston 32 27 42 36 16 20 21 37 Chelsea 41 34 33 27 32 26 15 21 Chicopee 48 37 47 45 24 17 15 38 Fall River 47 36 40 41 25 15 9 22 Holyoke 26 19 20 28 12 11 4 19 Lawrence 25 20 28 28 10 9 9 18 Lowell 38 29 41 43 21 17 15 34 Lynn 47 38 53 42 25 27 17 32 New Bedford 46 34 30 36 21 20 10 27 Pittsfield 62 47 52 50 27 19 24 41 Revere 49 45 46 49 30 35 25 22 Springfield 42 32 30 30 21 10 7 18 Taunton 61 52 52 51 40 29 22 41 Worcester 49 44 37 38 28 31 15 32
Next Steps Revision of School Improvement Plans Development of Individual Student Success Plans Increased professional development in literacy instruction Professional development in teaching vocabulary Increased application of classroom assessment
Next Steps Increased professional development in test-taking strategies Continued emphasis on Collins Writing Program Expanded professional development in the instruction of English Language Learners
Next Steps Increased implementation of standards-based math program Collegial sharing of best practices