Decision Making for Results and Data Teams
1k likes | 1.15k Vues
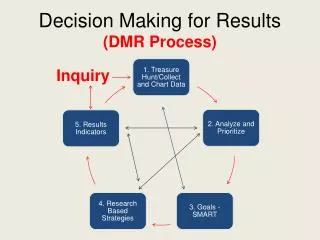
Decision Making for Results and Data Teams. Begin & end on time; Silence/’vibrate only’ on cell phones – please step outside away from the room if you need to take a call; If you need to step out for a minute, please do so; Be ‘here’; Keep sidebars to a minimum; Have fun together!.

Decision Making for Results and Data Teams
E N D
Presentation Transcript
Begin & end on time; Silence/’vibrate only’ on cell phones – please step outside away from the room if you need to take a call; If you need to step out for a minute, please do so; Be ‘here’; Keep sidebars to a minimum; Have fun together! “Can we agree to follow these --> norms today?” NORMS
Objectives for Both DMR & DT Know… • the data-driven Decision Making for Results process (DMR). • the relevance of cause and effect data and their impact on leadership, teaching, and learning. • the foundational components of the Data Teams structure. • the Data Teams process.
BIG Picture P.L.C. Professional Learning Communities How We Behave Continuous Systemic Process D.M.R Decision Making for Results D.T. Data Teams Teacher Level Road Map
The Big PictureAnother View PLC DISTRICT (D.M.R.) SCHOOL SITE (D.M.R.) GRADE LEVEL (D.T.) PLC PLC PLC
Principles ofDecision Making For Results(DMR spiral text pp. 2-3) Antecedents Accountability Collaboration
Becoming Data Driven(DMR spiral text p. 5) How is your site currently embracing a data-driven decision-making process that leads to results? • SEE RUBRIC, P. 5
Results-Driven Schools • Where is the proof? • 90/90/90 Schools, Reeves 2003 • Education Trust, 2002 • NCREL, 2000 • Consortium for Policy Research in Education, 2000 • EdSource, 2005 • Northern Illinois University Center for Governmental Studies, 2004 Data Driven Decisions
The 90/90/90 Schools • More than 90% of the students met or exceeded high academic standards, according to independently conducted tests of academic achievement. • More than 90% of the students are eligible for free or reduced lunch , a commonly used surrogate for low-income families. • More than 90% of the students are ethnic minority.
Common Characteristics of High Achievement Schools • A focus on academic achievement. • Clear curriculum choices. • Frequent assessment of student progress and multiple opportunities for improvement. • An emphasis on nonfiction writing. • Collaborative scoring of student work.
What Do You Think? “The value of the data emerges only when analysis provides insights that direct decisions for students.” White, 2005
Effect data: Outcomes or results Cause data: Professional practices that create specific effects or results Definitions and Examples(See p. 11 DMR spiral text: Be prepared to fill in and share)
Table Talk Why is Cause Data so often overlooked in schools? Why do you think looking at Cause Data could have powerful results for teachers and schools?
“Only by evaluating both causes and effects in a comprehensive accountability system can leaders, teachers, and policymakers understand the complexities of student achievement and the efficacy of teaching and leadership practices.” Consider this quote: Confer with a partner and be prepared to share. Reeves, 2006
Let’s Review Our Objectives Know… • the data-driven Decision Making for Results process (DMR) • the relevance of cause and effect data and their impact on leadership, teaching, and learning • the foundational components of the Data Teams structure. • the Data Teams process.
Data Teams are a model for continuous, collaborative action that inspires and empowers professionals to improve teaching, learning, and leadership for all.
Data Teams are small, grade-level, department, course-alike, or organizational teams that examine work generated from a common formative assessment.
Four Critical Questions that Guide a PLC 1. What are students supposed to know and be able to do? 2. How do we know when our students have learned? 3. How do we respond when students haven't learned? 4. How do we respond when students already know the content? PRIORITY STANDARDS COMMON FORMATIVE ASSESSMENTS INTERVENTION DIFFERENTIATION
The Data Teams Process
Data Team: “The Big Picture” Opening Before
Step 1: Establish Norms • Talk about Norms • Create Norms • Share Out
Step 1: Assign Roles • Understand the expectations for each role • Rotated or annual positions • See DT spiral text pp. 157-166
Step 2: Inquiry “Data-driven decision making begins by asking fundamental questions.” -- Doug Reeves Examples: • Do we have any achievement gaps? • Are any subgroups underperforming or excelling?
Step 2: Conduct a Treasure Hunt • Why? To gather and organize data in order to gain insights about teaching and learning practices • Considerations • Measures of data • Disaggregation • Triangulation • Reflection
Step 2: Conduct a Treasure HuntSample Key Data Systems Report
Accessing Data from CDE • ELA • MATH • CAREER TECH ED • ELD • HEALTH ED • HISTORY-SOCIAL SCIENCE • MODEL SCHOOL LIBRARY • P.E. • SCIENCE • VISUAL AND PERF. ARTS • DANCE, MUSIC, THEATRE, VISUAL ARTS • WORLD LANGUAGE
TriangulationA Look at Learning MAP CFA / Classroom Assmt CST / CMA
Step 3: Determine Focus ClusterRefer to p. 8 in resource packet Analyze Effect Data Use Key Data Systems reports, STAR reports, or other EFFECT data Rank every reported Grade Level/Discipline by cluster from highest performing to lowest performing (FORM A) This will create one component of the foundation for determining highest need area (Steps adapted from Ainsworth and Viegut, Common Formative Assessments, 2006, pgs 18-19)
Step 3: Analyze to PrioritizeReview Clusters to Determine Strengths, Weaknesses, Trends (Handout p. 6)
Step 3: Prioritize NeedsDocument CST Trends by Cluster Area FORM A
Step 3: Document CST Trends by Cluster Area (Use handouts pp. 6 & 9) Written/Oral Lang. Conventions 63.8% Writing App. 71.7% Word Analysis & Vocab 65.1% Lit. Response & Analysis 63.2% Writing Strategies 51.3% Reading Comp. 62.7%
Step 3: Identify Priority Standards Select key/high value standards from selected cluster(s) of focus and identify their location in Triads 1-5 After locations are determined, narrow the focus to High Value Priority Standard(s) in each triad If any tie breakers are needed, judge importance on School, District and Life Value of Standard
Step 3: Priority StandardsFour Areas to Consider Readiness: for Next Level of Learning Endurance: Concepts and Skills That Last Over Time External Exams: National, State, College, Career Leverage: Crossover Application to Other Areas
Step 3: Priority Standard Map by Triad/UnitSee Resource Packet p. 10 FORM B
ELA 7th Grade Priority Standards by Triad/Unit (Use FORM A to complete FORM B)
Step 4: Unwrap Priority Standard(Standard found on FORM B p. 11) FORM C FORM C
Step 4: Triad/Unit 2 Unwrapped Standard(Handout p. 14) __________________ __________ ______________________________ • LOCATE • INFORMATION 1 • A VARIETY OF… • CONSUMER • WORKPLACE • PUBLIC DOCUMENTS • USING 3
Step 5: The “Case” for the CFA • Assessment FOR learning (not OF learning) • Team-developed CFAs… • are more efficient • are more equitable • are more effective in monitoring and improving student learning • can build the capacity of the team to achieve at higher levels • are essential to systematic interventions when students don’t learn
Step 5: Develop Common Formative Assessment (CFA) Develop Common Formative Assessments (Pre and Post) for triad 1 based on the selected Priority Standard(s) Possible types of CFAs: Selected Response (T/F, m.c.) Constructed Response (short answer) – including a common rubric Combination Authentic Performance Task Intel-Assess question bank Data Director question bank Exam View question bank
Step 6: Establish Date for Administration and Scanning/Scoring of Pre-CFA
Table Talk What is the purpose and process of the Opening Meeting? Be prepared to share!