Download
1 / 12
120 likes | 287 Vues
ABRF meeting 09. Light Microscopy Research Group. Why are there no standards?. Imaging was largely an ultrastructure tool Digital imaging only common in last 10 years Little quantification done with images Image processing relatively new. Common components to all imaging systems.

E N D
ABRF meeting 09 Light Microscopy Research Group
Why are there no standards? Imaging was largely an ultrastructure tool Digital imaging only common in last 10 years Little quantification done with images Image processing relatively new
Common components to all imaging systems • Excitation light source • Tungsten lamp • Hg or Xeon lamp • Lasers • LED’s • Intermediate optics • Objective lens • Internal optical lens • Detection device • CCD camera • PMT
Performance standard in Imaging Why have standards? • Standardize systems • Reduce the subjective nature of imaging • Providing data that is accurate, reliable & reproducible • Detect problems before they are readily noticeable • Better understanding of image formation
What needs to be checked? • Stability of illumination source • Image fluorescent slide over time • Long (~ 1 hr) & short term (~ 1 min) • Uniformity & co-localization of detection device(s) • Image same object with all detectors • Evenness of illumination over the field • Measure homogeneity across field of view • Resolution • PSF • Spectral • Midl lamp • Scan of laser lines
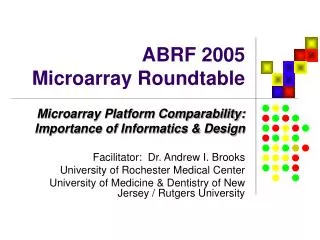
TetraSpeck™ microspheres (blue, green, orange and dark red) 4.0 µm single Z plane. Imaged with 5 PMTs, all channels combined in 6th panel. Demonstrated Colocalization in X & Y across all PMT’s Colocalization FocalCheck™ microspheres, 6.0 µm (blue interior green ring) 100 stack (wide field 60X 0.12µm steps) volume. Demonstrated Colocalization in X,Y, & Z Imaged with 2 PMTs
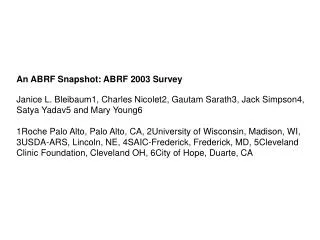
PSF widefield (60x 1.4 NA) Point Spread Function
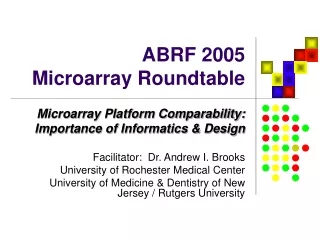
Spectral separation Image of a bead where the core and ring have a small spectral separation ring and core are pseudo-color for illustration purposes Ring 589/613 nm Core 578/605 nm FocalCheck™ fluorescence microscope test slide
Laser, stage, PMT stability: Purpose: Measure laser brightness/ fluctuation and PMT sensitivity/fluctuation over time. Protocol: Warm up lasers for one hour. Use the appropriate slide and laser combination. Note: several different laser lines may work with one slide. The red slide works well for most laser With a 10x or 20x (low NA) lens focus a surface scratch, then focus down ~20um Set up acquisition such that: Gain and offset should be set so that no PMT is saturated. The mean value should be ~150 (out of 255 gray levels). These values as well as laser power will vary for each laser used. Collect images every 30 sec for 3 hours. Use 1 line averages per frame. Use sequential scan to collect as many laser lines as possible, i.e. 1 laser line/ PMT Collect images every 0.5 sec for 5 min., one wavelength at a time and scan faster if necessary. Analysis: Calculate: mean brightness should be ~150 standard deviation the range in brightness (highest value-lowest value) longest time the laser stayed within 10% & 3% of the mean value for 3hr & 5 mins test respectively. Purposed procedures Notes: Since this procedure will test several microscope components, care must be taken with the interpretation of the data. For example, if a slow decrease is detected in all laser lines, the problem most likely will be with stage drift. There can be multiple problems superimposed on each other further complicating analysis. If stage drift is suspected a mirror slide would be the preferred test specimen because small changes in Z are more easily detected. Alternatively, the transmitted detector can be used (without a slide) to completely eliminate the stage and thermal drift from the analysis. If instability is still present after 3 hours, measuring for longer times may be required. The instability in the above graph is most likely from variability in the optical system and not the LASERs themselves. Colored slides & bead slides: (will be provided)
Field illumination: Purpose: Measure uniformity of illumination across the entire scan field Protocol: Warm up lasers for one hour. Use the 488 or 543/561 LASER combination for red slide from chorma slide (coverslipped area) Collect scan such that the intensity is near 150 no averaging, zoom @ manufacturers specification, (may not be 1), using as many lens as possible. Analysis: Using entire image Calculate: perform a scan profile diagonally and horizontally across the image to check for drop off near the edges. The typical 1X zoom variations are 10% in horizontal and 20% in diagonal. optional CV, Which is SD/mean intensity (ImageJ) Laser power needs to be ~ xxmW at the back aperture of the objective lens. The best way to determine this is with a power meter. PMT co-registration: Purpose: Determine to what extent an object (bead) collected with different PMT register/superimposes to each other Protocol: Bead slide: (will be provided) Tetraspeck beads (blue, green orange, dark red 0.5 µm) Use high NA (>1.2) lens, i.e., 40X or higher. Collect such that the pixel size is half the resolution of the lens. Zoom near 10 will be needed. Use standard three or four color protocol. Collect Z series using sequential scans of three or more PMTs Do not forget to use the NDD for MP scopes. Analysis: Using a line scan function, plot the intensities across the bead for each slice in the stack. The brightest slice is the “most in focus” This should be the same Z position for all PMTs. Using ImageJ measurement function determine the center of mass for the “most in focus” slice for all the PMTs. Determine the displacement among the PMT’s. Performing this on more than on bead will help to separate aberrant beads (i.e. not fully attached). Single beads should be “cropped out” for the measurements. Zoom 1 Zoom 1.25 Images of fluorescent test slide (20X) & results of line scans “most in focus” slices from each PMT & center of mass values (µM) for top most bead