Download
1 / 15
150 likes | 262 Vues
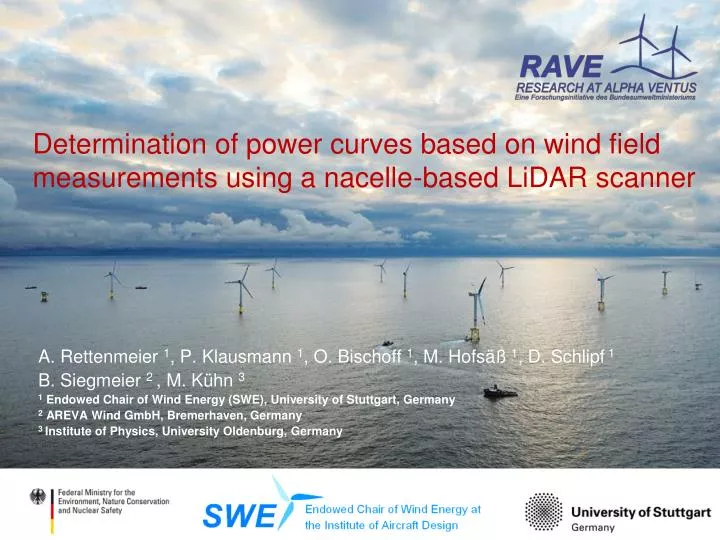
Determination of power curves based on wind field measurements using a nacelle-based LiDAR scanner. A. Rettenmeier 1 , P. Klausmann 1 , O . Bischoff 1 , M. Hofsäß 1 , D. Schlipf 1 B. Siegmeier 2 , M . Kühn 3 1 Endowed Chair of Wind Energy (SWE), University of Stuttgart, Germany

E N D
Determination of power curves based on wind field measurements using a nacelle-based LiDAR scanner A. Rettenmeier 1, P. Klausmann1, O. Bischoff 1, M. Hofsäß1, D. Schlipf1 B. Siegmeier2 , M. Kühn 3 1 Endowed Chair of Wind Energy (SWE), University of Stuttgart, Germany 2 AREVA Wind GmbH, Bremerhaven, Germany 3 Institute of Physics, University Oldenburg, Germany
Table of Contents • Motivation • Experiment setup • SWE LiDAR system • Power curve determination • Outlook &Conclusions [Fig. SWE] [Fig. SWE]
Motivation Need of power curves • Calculation of annual energy production • Sales argument / economic profitability • Worldwide comparability (IEC 61400-12-1) • Reasons for developing new techniques • Increasing hub heights of wind turbines • Cost expansive determination of p-v- curves offshore/ complex terrain Nacelle-based LiDAR wind field measurements taking into account • Whole swept rotor disc • Wind direction (slow variation) • Horizontal wind shear, vertical wind shear (fast variation) • More free valid areas Less sectors to exclude Faster measurement campaigns 3
Experiment setup: wind turbine & met mast • AREVA Wind GmbH • M5000 prototype • Rated power: 5 MW • 116m rotor diameter • 102m hub height • Measurement project • Power curve and load measurement (acc. IEC) • Met mast (102 m height) • Meteorological sensors • Data acquisition system • LiDAR device 1st Class anemometer [Fig. SWE] Temperature sensor and 3D-sonic anemometry
Experiment setup: LiDAR system and scanner LiDAR deviceandscanner LiDAR systeminstalled on thenacelle [Fig. SWE, EWEC 2010]
Howtoscantheincoming wind field • Basic Trajectory • Origin 3:4 Lissajous figure, complex harmonicmotion • Fastest way to scan(8.4 sec), good temporal and spatial resolution • Adapted to 7x7 grid points • Use of pulsed LiDAR System: 5 focus planes simultaneously hub height
vLOS aerosol vWind f0 +fd Wind field f0 LiDAR Vertical actuator Mirror y, rotor plane P Escaping laser beam x LiDAR system Window Laser beam Horizontal actuator Laser beam from „Windcube“ SWE LiDAR system Liss2Gridopt Liss2Gridopt 5 focus planes simultaneously • Assumptions: • Plane parallel wind field • vw=0 List of line-of-sight velocities 8
State of the art of power curve determination From the scatter plot to a power curve(separating the measurement data into BINs of 0.5 m/s)
Power curve determination – Big Cross u1 u2 u3 u4 u5 Liss2GridOpt [Fig. SWE]
Power curve determination - 2nd order polynomial function uTop_Layer uMiddle_Layer uLowest_Layer [Fig. SWE]
Power curve determination – area weighted rotor disc A1 A2 A3 A4 A5 A6 A7 [R.Wagner] A : rotor swept area : average wind speed of layer i Ai : area of the circular segment 12
LiDAR power curves • Comparison criteria • Summed up (over all bins) the standard deviation of Pelof each BIN • Summed up (over all bins) the difference between Pel(anemometer binning, IEC) and Pel(LiDAR binning) of each BIN
Conclusion and outlook • Nacelle-based LiDAR power curve determination over the whole rotor disc have less scatter and less standard deviation higher accuracy • Assumptions necessary • Various determination approaches to investigate • Further studies are necessary • Fundamental investigations concerning vertical shear & turbulence measurements • Investigation of p-v- curves with interpolated measurement points of different focus planes • Use of further quality and comparison criteria for best fit of measurement points • Reduction of measurement points needed (with sufficient accuracy and information) • Best/most optimal beam configuration • Simple LiDAR device without moving parts
Thank you for your attention! Dank U wel voor uw aandacht! Merci de votre attention ! WindForS The Southern German Wind Energy Research Alliance Contact Andreas Rettenmeier, rettenmeier@ifb.uni-stuttgart.de http://www.uni-stuttgart.de/windenergie/LIDAR.html AcknowledgementThis project (No. 0327642) is funded by the German Federal Ministry for the Environment, Nature Conservation and Nuclear Safety (BMU).