Scottish Pollution Mapping
80 likes | 241 Vues
Scottish Pollution Mapping. Nicola Brophy nicola.brophy@aeat.co.uk. Background. AEA’s Pollution Climate Mapping team produce UK maps on behalf of Defra and the Devolved Administrations 2004 & 2005 – Scotland Specific Scottish meteorological data

Scottish Pollution Mapping
E N D
Presentation Transcript
Scottish Pollution Mapping Nicola Brophy nicola.brophy@aeat.co.uk
Background • AEA’s Pollution Climate Mapping team produce UK maps on behalf of Defra and the Devolved Administrations • 2004 & 2005 – Scotland Specific • Scottish meteorological data • Scotland only AURN sites for calibration of the model • Mixed results • Particularly for gravimetric PM10 • Refocusing efforts
Introduction to the Model Components of the model: • Point source model • Environment Agency and SEPA database • Area source model • Dispersion kernel • Long range transport and secondary inorganic aerosols http://www.airquality.co.uk/archive/reports/cat09/0709241126_dd12005mapsrep_v2.pdf
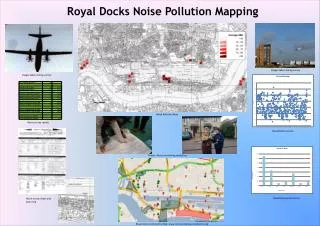
Examples of Mapping Results Scottish model NOx background annual mean 2005 map for Scotland (g m‑3 as NO2) Verification of Scottish NOx background and roadside annual mean 2005 model (g m‑3 as NO2)
Further Work on Scottish Mapping Project • 2006 • Scotland specific verification • 2007 • Scotland specific gravimetric particulate maps due to increased number of sites – 1 year only • To include PM10 and PM2.5 • Scotland specific verification for other pollutants
Model developments • Improvements and changes to Models • PM10 • Residual concentrations reduced • More certainty in sea salt concentrations • Secondary inorganic aerosols • Iron • Change to calibration • Singles relationship for calibration • Different types of dispersion kernels for differing land types • Biomass!
Biomass Burning • Government committed 15% of all energy to be from renewable sources by 2020 • Defra and the Scottish Government assessing the air quality risks from burning biomass • AEA developing projection maps for 2010, 2015 and 2020 • Scenarios • Uptake of 5-7% biomass burning • Fuel replacement • Regionally specific variations • Pollutants: PM10, PM2.5, NOx and NO2
Questions… nicola.brophy@aeat.co.uk andrew.kent@aeat.co.uk http://www.airquality.co.uk/archive/reports/cat09/0709241126_dd12005mapsrep_v2.pdf