Download

1 / 16
170 likes | 270 Vues
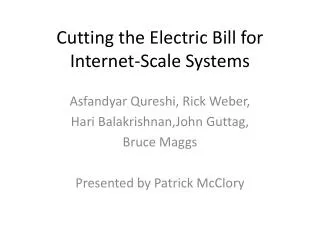
Cutting the Electric Bill for Internet-Scale Systems. Kevin Leeds. The Concept. Energy costs differ by location Reroute customer requests to cheaper locations. Customer. Cheaper energy. Closer. $50/MWh. $30/MWh. Why This Is Possible. Electricity prices vary per region

E N D
Cutting the Electric Bill for Internet-Scale Systems Kevin Leeds
The Concept • Energy costs differ by location • Reroute customer requests to cheaper locations Customer Cheaper energy Closer $50/MWh $30/MWh
Why This Is Possible • Electricity prices vary per region • Price variation between coal and hydro • Also by hour (up to factor of 10) • Solar power, wind power, tide • Trends are detectable • Power grids may be over/under-utilized
Potential Savings • Google spends over $38M on electricity per year. • 3% energy cost reduction saves ~ $1M
Energy Elasticity • Energy Consumed / Load on cluster • Idealistic: 0 load = 0% peak power • Realistic: 0 load ~ 60% peak power (current state-of-the-art) • Without energy elasticity, no savings can be gained
Constraints Affect Outcomes • Elasticity • Existing systems: ~2% savings • Fully-elastic system: ~13% savings • Bandwidth constraints on fully-elastic • No constraints: ~30% savings • 95/5 constraints: ~13% savings • Client-server distances • Constrained: ~45% max savings • Non-constrained: ~35% max savings
Wholesale Electricity Markets • Regional Transmission Organization (RTO) • Runs several parallel wholesale markets • Day-ahead markets (expectations for the day) • Real-time markets (real-time price calculations) • Changes in price • Demand rises, more expensive sources of energy are called upon (congestion exists)
Cluster Power Calculations • Variables • F = Fixed power • V = Variable power • E/r = Derived Constants • PUE = Power Utilization Efficiency • n = # of servers in cluster • u = average CPU utilization
What about routing energy increases? • Shouldn’t be significant • 1 kJ/Google Query • 2 mJ/Packet passing through router
Reaction Delays • Faster reaction to changes = lower cost
Future Work • Weather Differentials • Cool centers with outside air (AZ vs MN) • Implementing Joint Optimization • Systems already reroute traffic based on bandwidth costs, performance, and reliability – add local energy costs
Questions/Comments • Thank you!