Download
1 / 51
510 likes | 636 Vues
Large-scale Data Management Challenges of Southern California Earthquake Center (SCEC). Philip J. Maechling (maechlin@usc.edu) Information Technology Architect Southern California Earthquake Center Research and Data Access and Preservation Summit Phoenix, Arizona 9 April 2010.

E N D
Large-scale Data Management Challenges of Southern California Earthquake Center (SCEC) Philip J. Maechling (maechlin@usc.edu) Information Technology Architect Southern California Earthquake Center Research and Data Access and Preservation Summit Phoenix, Arizona 9 April 2010
Consider the Digital Data Life Cycle Can we Validate this Life Cycle Model against Digital Data Life Cycle Observations?
The SCEC Partnership National Partners International Partners Core Institutions Participating Institutions
SCEC Member Institutions(November 1, 2009) Core Institutions (16) California Institute of Technology Columbia University Harvard University Massachusetts Institute of Technology San Diego State University Stanford University U.S. Geological Survey, Golden U.S. Geological Survey, Menlo Park U.S. Geological Survey, Pasadena University of California, Los Angeles University of California, Riverside University of California, San Diego University of California, Santa Barbara University of California, Santa Cruz University of Nevada, Reno University of Southern California (lead) Participating Institutions (53) Appalachian State University; Arizona State University; Berkeley Geochron Center; Boston University; Brown University; Cal-Poly, Pomona; Cal-State, Long Beach; Cal-State, Fullerton; Cal-State, Northridge; Cal-State, San Bernardino; California Geological Survey; Carnegie Mellon University; Case Western Reserve University; CICESE (Mexico); Cornell University; Disaster Prevention Research Institute, Kyoto University (Japan); ETH (Switzerland); Georgia Tech; Institute of Earth Sciences of Academia Sinica (Taiwan); Earthquake Research Institute, University of Tokyo (Japan); Indiana University; Institute of Geological and Nuclear Sciences (New Zealand); Jet Propulsion Laboratory; Los Alamos National Laboratory; Lawrence Livermore National Laboratory; National Taiwan University (Taiwan); National Central University (Taiwan); Ohio State University; Oregon State University; Pennsylvania State University; Princeton University; Purdue University; Texas A&M University; University of Arizona; UC, Berkeley; UC, Davis; UC, Irvine; University of British Columbia (Canada); University of Cincinnati; University of Colorado; University of Massachusetts; University of Miami; University of Missouri-Columbia; University of Oklahoma; University of Oregon; University of Texas-El Paso; University of Utah; University of Western Ontario (Canada); University of Wisconsin; University of Wyoming; URS Corporation; Utah State University; Woods Hole Oceanographic Institution
Lithospheric Architecture & Dynamics Fault & Rupture Mechanics Earthquake Forecasting & Prediction Crustal Deformation Modeling Seismic Hazard & Risk Analysis Unified Structural Representation Ground Motion Prediction • Southern California Earthquake Center • Involves more than 600 experts at over 60 institutions worldwide • Focuses on earthquake system science using Southern California as a natural laboratory • Translates basic research into practical products for earthquake risk reduction, contributing to NEHRP Tectonic Evolution & B.C.s Deformation Models Earthquake Rupture Models Earthquake Rupture Forecasts Fault Models Block Models Seismic Hazard Products Risk Mitigation Products Anelastic Structures Ground Motion Simulations Attenuation Relationships SCEC Earthquake System Models & Focus Groups
SCEC Leadership Teams Board of Directors Planning Committee Staff
Origin time Stress transfer Fault rupture Surface faulting Landslides Dynamic triggering Liquifaction Fires Slow slip transients Seismic shaking Socioeconomic aftereffects Structural & nonstructural damage to built environment Tectonic loading Stress accumulation Nucleation Seafloor deformation Human casualties Tsunami Disease 0 year decade minute hour day century decade year month week day Anticipation time Response time ------ Aftershocks ------------------------------------------------------------------- ----- Foreshocks ----- Earthquakes are system-level phenomena… • They emerge from complex, long-term interactions within active faults systems that are opaque – thus are difficult to observe • They cascade as chaotic chain reactions through the natural and built environments – thus are difficult to predict
Public and Governmental Forecasts Automated prospective performance evaluation of forecast models over time within collaborative forecast testing center. Automated retrospective testing of forecast models using community defined validation problems. Engineering and interdisciplinary Research Collaborative Research Project Computational codes, structural models, and simulation results versioned with associated tests. Individual Research Project Development of new computational, data, and physical models. Contribution and annotation of digital artifacts. CME cyberinfrastructure supports a broad range of research computing with computational and data resources. CME Platform and Data Administration System CME Platform and Data Management TAG Discovery and access to digital artifacts. Programmable Interfaces Real-time Earthquake Monitoring HPC Resource Providers Seismic Data Centers External Seismic /Tsunami Models
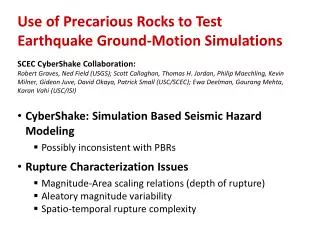
Echo Cliffs PBR Echo Cliffs PBR in the Santa Monica Mountains is >14m high and has a 3-4s free period. This rock withstood ground motions estimated at 0.2g and 12 cm/s during the Northridge earthquake. Such fragile geologic features give important constraints on PSHA.
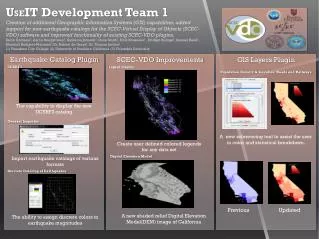
Then, validate simulation model by comparing simulation results against observational data recorded by seismic sensors . (red – simulation results, black – observed data)
SCEC Roadmap to Petascale Earthquake Computing 2004 M8 2.x TeraShake1.x 40-m spacing and 435 billion mesh points, M8 2.x to run on 230K NCCS Jaguar cores, the world most powerful machine. First large wave propagation simulations of Mw7.7 earthquakes on the southern San Andreas with maximum frequency of 0.5Hz run using kinematic source descriptions based on the Denali earthquake. 240 SDSC DataStar cores used, 53 TBs outputs, largest simulation outputs recorded. ShakeOut 2.x Simulations of Mw7.8 earthquakes with max 1.0Hz using source descriptions generated by SGSN dynamic rupture simulations. The ShakeOut 2.x dynamic rupture simulations were constructed to produce final surface slip equivalent to the ShakeOut 1.x kinematic sources. 32K TACC Ranger cores used. BGW M8 3.2 BG/L 96% Parallel efficiency on 40K TJ Waterson BG/L cores. Improved source descriptions based Wave propagation simulation: dx=25m, Mw8.0, 2-Hz, 2,048 billion mesh points, 256x bigger than current runs 2010 The most read article of year 2006 TeraGridViz Award 2005 TACC Ranger 2012 Big 10 2008 New model under development to deal with complex geometry, topography and non-planar fault surfaces. TeraShake2.x Simulaion of 9.0 Megaquake in Pacific Northwest M8 1.x Simulations of Mw7.7 earthquakes in 2005-2006 using source descriptions generated by dynamic rupture simulations. The dynamic rupture simulations were based on Landers initial stress conditions, used 1024 NCSA TG cores. Simulations of Mw8.0 scenario on SAF from the Salton Sea to Parkfield ('Wall-to-Wall'), up to 1.0Hz. The source description was generated by combining several dynamic Mw7.8 dynamic source descriptions ('ShakeOut-D’). 96K NICS Kraken cores used. ALCF BG/P 15 Mio SUs, awarded, largest NSF TG allocation INCITE allocations ShakeOut verification with 3 models NICS Kraken 2007 2011 2009 SciDAC OASCR Award M8 3.1 Chino Hills 1.x ShakeOut 1.x Comparison of simulated and recorded ground motions for 2009 Mw5.4 Chino Hills, two simulations were conducted using meshes extracted from CMU eTree database for CVM4 and CVM-H, 64K NICS Kraken cores used. Dynamic rupture simulation, dx=5m (50 x 25 x 25km). Improve earthquake source descriptions by integrating more realistic friction laws into dynamic rupture simulations and computing at large scales including inner-scale of friction processes and outer-scale of large faults Simulations of Mw7.8 with max frequency of 1.0Hz run using kinematic source descriptions based on geological observations.1920 TACC Lonestar cores.
Panel Questions • What technical solutions exist that meet your academic project requirements? • What requirements are unique to the academic environment? • Are there common approaches for managing large-scale collections?
Simulation Results Versus Data • Context of this workshop is Research Data Management. • I would like to communicate characteristics of the data management complete perform seismic hazard computational research. • I will refer to our simulation results as “data” • Some groups distinguish observational data from simulation results • This distinction becomes more difficult as observation and simulation results are combined. • For today’s presentation, I will focus on management of SCEC simulation results which may include both observational data and simulation results.
SCEC Storage Volume by Type Estimated SCEC Data Archives (Total Current Archives ~ 1.4 PB)
SCEC Storage Elements (Files,Rows) by Type Estimated SCEC Data Archives (Total Current Archives ~ 100M files, 600M rows)
Consider the Digital Data Life Cycle Estimated SCEC Simulation Archives in Terabytes by Storage Location
Goal: Sources & Receivers: • 150 three-component stations [Nr] • 200 earthquakes [Ns] • 1 Hz body waves • Up to 0.5 Hz Surface waves Simulation parameters: • 200m, 1872 M mesh points • 2min time series, 12000 time steps Costs: • 2TB per SWF • 6TB per RGT • 2Hr per run • 10.4 M CPU-Hrs (650 runs, 3.6 Months on 4000 cores) • 400 - 600 TB
Data Management Context for SCEC • Academic research groups responding to NSF proposals. Aggressive, large-scale, collaborative with need for transformative, innovative, original research (bigger, larger, faster) • Data management tools and processes managed by heavily burdened academic staff
Data Management Context for SCEC • Academic research very cost sensitive for new technologies • HPC capabilities largely based on integrating existing cyberinfrastructure (CI) (not new CI development) • Largely based on use of other peoples computers and storage systems (resulting in widely distributed archives)
Panel Questions • What technical solutions exist that meet your academic project requirements? • What requirements are unique to the academic environment? • Are there common approaches for managing large-scale collections?
SCEC Milestone Capability Runs * benchmarked, ** estimated
Data Transfer, Archive and Management • Input/output data transfer between SDSC disk/HPSS to Ranger disk at the transfer rate up to 450 MB/s using GlobusGridFTP • 90k – 120k files per simulation, 150 TBs generated on Ranger, organized as a separate sub-collection in iRODs • Direct data transfer using iRODs from Ranger to SDSC SAM-QFS up to 177 MB/s using our data ingestion tool PIPUT • Sub-collections published through SCEC digital library (168 TB in size) • integrated through SCEC portal into seismic-oriented interaction environments (Zhou et al., CSO’10)
CyberShake Data Management Numbers • CyberShake • 8.5 TB staged in (~700k files) to TACC’s Ranger • 2.1 TB staged out (~36k files) to SCEC storage • 190 million jobs executed on the grid • 750,000 files stored in RLS CyberShake map
CyberShake Production Run - 2009 • Run from 4/16/09 – 6/10/09 • 223 sites • Curve produced every 5.4 hrs • 1207 hrs (92% uptime) • 4,420 cores on average • 14,540 peak (23% of Ranger) • 192 million tasks • 44 tasks/sec • 3.8 million Condor jobs • 192 million files • 11 TB output, 165 TB temp
Challenge: Millions of tasks • Automation is key • Workflows with clustering • Include all executions, staging, notification • Job submission • Data management • Millions of data files • Pegasus provides staging • Automated checks • Correct number of files • NaN, zero-value checks • MD5 checksums
What is DAG-workflow • Jobs with dependencies organized in Directed Acyclic Graphs (DAG) • Large number of similar DAGs make up a workflow
GriPhyN Virtual Data System • Virtual data language • Users define desired transformations • logical names for data and transformations • Virtual data catalog • Stores information about transformations, derivations, logical inputs/outputs • Query tool • Retrieves necessary transformations given a description of them • Gives an abstract workflow • Pegasus • Tool for executing abstract workflows on the grid • Virtual Data Toolkit (VDT): part of GriPhyN and iVDGL projects • Includes existing technology (Globus, Condor) and experimental software (Chimera, Pegasus) The Globus View of Data Architecture
Application MetadataService Planner: Data location, Replica selection, Selection of compute and storage nodes Replica Location Service Information Services Security and Policy Executor: Initiates data transfers and computations Data Movement Data Access Compute Resources Storage Resources Functional View of Grid Data Management Location based on data attributes Location of one or more physical replicas State of grid resources, performance measurements and predictions The Globus View of Data Architecture
Panel Questions • What technical solutions exist that meet your academic project requirements? • What requirements are unique to the academic environment? • Are there common approaches for managing large-scale collections?
Treat Simulation Data as Depreciating Asset Simulation results differ from observational data. • Tends to be larger • Can be (often) recomputed • Often decreases in value with time • Less well-defined metadata SCEC: An NSF + USGS Research Center
Collaborate with Existing Data Center Avoid re-inventing Data Management Centers • (Re)-Train Observational data centers to manage simulation data • Change the culture so deleting data is acceptable SCEC: An NSF + USGS Research Center
Simulation Data as Depreciating Asset Manage simulation results as depreciating asset: • Unique persistent ID’s for all sets • Track cost to produce, and cost to re-generate for every data set SCEC: An NSF + USGS Research Center
Simulation Data as Depreciating Asset Responsibilities of researchers who want a lot of storage: • Default storage lifetime is always limited • Longer term storage-based on community use, community value, and readiness for use by community • Burden on researchers for long term storage is more time adding metadata SCEC: An NSF + USGS Research Center
Remove the Compute/Data Distinction Compute models should always have associated verification and validation results and data sets should always have codes demonstrating access and usage. Apply automated acceptance tests for all codes and access retrieval codes for all data sets. SCEC: An NSF + USGS Research Center
Data Storage Entropy Resistance Data sets will grow to fill storage • We recognize the need to encourage efficient storage practices as routine SCEC: An NSF + USGS Research Center
Data Storage Entropy Resistance We are looking for data management tools that provide project management with tools to administer simulation results project-wide by providing information such as: • Total Project and User Storage in use • Time since access for data • Understanding of backup and replicas SCEC: An NSF + USGS Research Center
Metadata Strategies Development of simulation metadata lead to extended effort with minimal value to geoscientists: • Ontology development as basis for metadata not (yet?) shown significant value in field. • Difficulty based on need to anticipate all possible future uses. SCEC: An NSF + USGS Research Center
Controlled Vocabulary Tools Controlled vocabulary management based on community-based wiki systems with subjects and terms used as tags in simulation data descriptions: • Need tools for converting wiki, labels, and entries to relational database entries • Need smooth integration between relational database (storing metadata) and wiki system SCEC: An NSF + USGS Research Center
Metadata Strategies Current simulation metadata based on practical uses cases: • Metadata saved to support reproduction of data analysis described in publications. • Metadata saved needed to re-run simulation. • Unanticipated future uses of simulation data often not supported SCEC: An NSF + USGS Research Center