Download
1 / 12
130 likes | 296 Vues
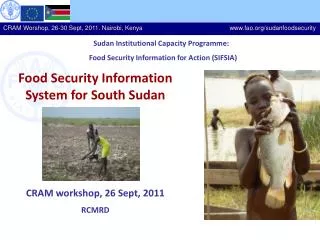
Sudan Institutional Capacity Programme: Food Security Information for Action (SIFSIA). Food Security Information System for South Sudan CRAM workshop, 26 Sept, 2011 RCMRD. Republic of South Sudan. South Sudan has an area of approximately 640 000 square km,

E N D
Sudan Institutional Capacity Programme: Food Security Information for Action (SIFSIA) Food Security Information System for South Sudan CRAM workshop, 26 Sept, 2011 RCMRD
Republic of South Sudan • South Sudan has an area of approximately 640 000 square km, • Has a population of approx 8.5-10 million people, • Has one of the lowest population density in sub-Saharan Africa, averaging only 13.5 inhabitants per square km (FAO/WFP, 2011). • Has had civil wall for over 2 decades • Stability only came in 2005 when the CPA was signed • The country got its independence on the 9th of July 2011, • It is the 54th and 193rd member of AU and UN respectively.
Institutional setup and crop monitoring • South Sudan is divided into 10 states (provinces) • It has a federal system where each state operates semi autonomously • Crop monitoring is mostly by remote sensing • It is complemented by field surveys • while capacity in the ministries is a challenge, the FAO SIFSIA/EU funded project has provided facilities for crop monitoring in the states • Capacity building activities have been conducted in collaboration with JRC and FEWSNet
Agricultural Season monitoring in South Sudan • South Sudan experiences 2 rainy seasons • Because of the war situation, climate and agronomic data is very limited • therefore, there is extensive use of remote sensing data for crop and rangeland monitoring • Remote sensing data is used through out the season • This is complimented with field surveys • Expert Assessment – Trained extension staff or field technicians are often able to estimate crop production or yield by using various methods(crop condition, plant vigor, plant density, and so on) of the crop in the field. • The assessment provides mean yields for extrapolation • Mean cultivated area is used for production estimation by county and by state Uni-modal rainfall Bi-modal rainfall
Natural Resource Information System (Land Cover Database) • the observed physical cover including the vegetation (natural or planted) and human constructions which cover the earth's surface has been done. • This was developed using Landsat and Spot imagery • The land cover database was completed in 2010 • Documentation of the land cover is extremely important for crop monitoring for food security • At the moment only less than5% of the land in South Sudan is intensively cultivated. Cropped area in South Sudan
Average yields of sorghum Factors affecting crop yields in South Sudan • Weather (late onset, dry spells etc) • Farm inputs availability • Ethnic conflicts • Management practices Historical Cereal Production for South Sudan Delay in rainfall onset in 2011
Cumulative figures of conflict incidences in 2011 as of 15 August, 2011
Cereal production for 2011 in South Sudan • A Rapid Crop Assessment was conducted from 2 – 16 August, 2011 • Crop performance is below 2010 and 2011 rainfall is also below 2010 • cereal production is estimated to drop by 30 – 40 % in 2011 • Extensive crop assessment, FAO/WFP will take place from 17Oct-12 Nov, 2011 August Modis comparison of 2010 vs 2011 Mainly livestock area
Daily Weather Information System (Automatic Weather Stations) • climate information is critical for agric activities • The severity of a drought can only be understood with climate data analysis • RFE information is very useful for this kind of analysis
Crop and Livestock Market Information System • Market information is critical for food security. • The more the expensive the food commodities, the more communities become food insecure • This information is important for government policy decisions