Download
1 / 25
260 likes | 408 Vues
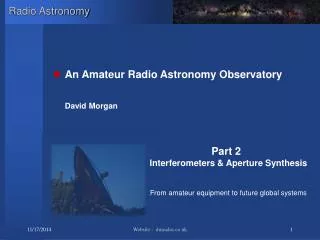
Radio Astronomy. An Amateur Radio Astronomy Observatory David Morgan. Part 2 Interferometers & Aperture Synthesis From amateur equipment to future global systems. Radio Astronomy. Radio Astronomy. A. B. Total Power Receiver systems - Part 1 Interferometers - Part 2 (A&B)

E N D
Radio Astronomy • An Amateur Radio Astronomy Observatory David Morgan Part 2 Interferometers & Aperture Synthesis From amateur equipment to future global systems Website - dmradas.co.uk
Radio Astronomy Website - dmradas.co.uk
Radio Astronomy A B • Total Power Receiver systems - Part 1 • Interferometers - Part 2 (A&B) • Basic concept • Observing ‘point sources’ • Spatial resolution and sensitivity • Multiple baselines & aperture synthesis • Fringe visibility functions • Today’s best instruments • The future global radio telescope - The SKA Radio Window Origin of Galaxies Cosmic hydrogen distribution < 300,000years after big bang SKA 2020 VLA New Mexico Mk1 at Jodrell Bank Website - dmradas.co.uk
Radio Astronomy - InterferometerBasics source moves across sky Arrival angleqchanges phase difference changes • Adding two waves same signal from source wave crests sometimes ‘instep’ sometimes out of step depending on arrival angle output Website - dmradas.co.uk
Radio Astronomy +1 +1 +1 +2 0 0 0 0 -2 -1 -1 -1 moved l/2 The resulting amplitude varies between 2 and 0 depending the ‘Phase’ relationship between the two signals 0 Peaks on signal 1 cancel troughs on signal 2 Result = ZERO • Adding signals together - Phasing of two waves Signal 1 Signal 2 Website - dmradas.co.uk
Radio Astronomy Moves slowly Moves quickly Sub Hz MHz The BEAT or ‘Fringe’ frequency depends on Earth’s rotation & antenna baseline 2 This is the signal that gets recorded BEAT AMPLITUDE 0 Time Website - dmradas.co.uk
Radio Astronomy • Combined signal - directional antennas beat frequency signal sidelobes sensitive only in forward direction position / time • Combined signal - omni directional antennas beat frequency signal equally sensitive in all directions position / time Website - dmradas.co.uk
Radio Astronomy Wavelength l Phase difference Antenna # 1 Antenna # 2 Baseline b • Radio Interferometry - ‘enables detection of small sources’ • Signals drift in and out of phase as the angle to the source line of sight from the baseline changes over time (Right Ascension) As q changes the signals go in and out of phase so that signal strength varies with angle and therefore time Example of Interferometer fringes Response of single antenna sidelobe sidelobe Angular resolution Response of two antennae Time Website - dmradas.co.uk
Radio Astronomy • Why use an Interferometer ? • Higher spatial resolution than a Total Power system using only one antenna • Pick out small diameter sources against a general bright radio background • The hardware is cheaper (small antennae spaced apart v single very large antenna) • Interferometer more gain stable than a total power system • But more processing is required to recover the source brightness ‘picture’ • Most modern professional Radio Telescopes are Interferometers Frequency = 408MHz l= 0.735m & baseline =30m 30m East – West Baseline Dq = 0.735/ 30 = 0.0245 rads or 1.4 degrees Earth rotation angular velocity = 150 / hr Fringe frequency = 1.4 /15 hrs = 5.6mins This time is > signal averaging TC My Amateur Radio Telescope Interferometer Website - dmradas.co.uk
Radio Astronomy 30m apart = 41 wavelengths @ 408MHz West Tower East Tower • My twin 15 element Quagi antenna 30m E-W Interferometer Website - dmradas.co.uk
Radio Astronomy When two are used as an interferometer Beamwidh < 1.40 • Twin Quagi Antenna responses • Each twin Yagi unit has a response shown below Cartesian Antenna response Polar Antenna response Antenna output -900 00 +900 Angle from antenna bore sight 14dB Gain & 170 Beamwidth Website - dmradas.co.uk
Radio Astronomy Source moves through beams • Moving through interferometer ‘beams’ Antenna pattern beat frequency signal position / time Website - dmradas.co.uk
Radio Astronomy Taurus Taurus A • Observable discrete ‘Point’ sources (northern hemisphere) Cass A 3C461 RA 23:23:21, DEC +58:49:59 Cygnus A 3C405 RA 19:59:28, DEC +40:44:00 Virgo A Virgo Virgo A 3C274 (M87) RA 12:30:48, DEC +12:22:59 Taurus A 3C144 (crab) RA 05:34:30, DEC +22:00:57 Website - dmradas.co.uk
Radio Astronomy Taurus Galactic background • Taurus signal embedded in galaxy background System Data Website - dmradas.co.uk
Radio Astronomy • Extracted Signal from Taurus A - ‘The Crab’ Signal ‘fringes’ Taurus A Crab Nebula NGC 1952 6,300Ly SNR AD 1054 30m separation Website - dmradas.co.uk
Radio Astronomy Taurus A Plot of Fringe amplitude Transit was ‘bang on schedule’ This fringe amplitude plot was derived by cross - correlation of the signal on the previous graph with the theoretical interferometer fringe frequency Fringe frequency 1/ 5.6mins Source strength = 1200Jy 1Jy = 10-26W/m2/Hz So we receive from the Crab about 1.2x10⁻²³W/m2/Hz This produces about 0.01mV in the antenna Website - dmradas.co.uk
Radio Astronomy Cross Correlation Function Transit • Cross Correlation (are you like me ?) Signal from Taurus A 16:00 – 01:00GMT 25/1/08 Calculated fringe signal period =5.6min Website - dmradas.co.uk
Radio Astronomy • Virgo A M87 Good example of how an interferometer can distinguish compact from diffuse Radio sources Radio Galaxy M87 Virgo A NGC4486 Giant Elliptical Galaxy with intense relativistic jet ~ 60 million LY distant Looking toward centre of galactic plane Looking toward Galactic N Pole Virgo A is a compact Radio Source Website - dmradas.co.uk
Radio Astronomy This is close to the limit of what can be measured with my 2 antenna interferometer Another view of the energetic jet in M87 Virgo A Virgo A Radio Spectrum Flux =klx (x=spectral index) Website - dmradas.co.uk
Radio Astronomy Virgo A M87 Fringe Amplitude This fringe visibility plot was derived by cross - correlation of the signal with the theoretical interferometer fringe frequency There are no more sources visible from the northern hemisphere at this level Pulsars are < 100Jy and would require a very costly 10m dia dish Website - dmradas.co.uk
Radio Astronomy Small source of angular size < l/b Distributed source (made up of many point sources) S Wavelength = l S2 S1 S3 S4 Single defined phase difference Produces a clear ‘fringe pattern’ Multiple sources ‘fill in’ fringes leading to ‘flat line’ • Estimating the size of a radio source • If the source produces fringes then we know that its angular diameter is less than l/b (l= wavelength, b = baseline) • The longer the baseline the smaller the source diameter that can be measured • Large distributed sources don’t produce fringes Website - dmradas.co.uk
Radio Astronomy • Example of distributed & ‘point’ sources Website - dmradas.co.uk
Radio Astronomy SNR AD 1667 CASS A Jet Massive Black Hole ? Virgo A Elliptical Galaxy • Comparison of strengths of ‘point’ radio sources Cygnus A Website - dmradas.co.uk
Radio Astronomy • Amateur capability • Possible to detect point sources within the Milky Way - Taurus A • Possible to detect other Galaxies - Virgo A (60MLy) • Easily possible to detect powerful Radio Galaxies - Cygnus A 700MLy • Limiting sensitivity ~ 100Jy or 10-24 W/m2/Hz • Pulsar detection requires 100x increase in sensitivity • This would need a larger antenna array Cygnus A Radio Galaxy Website - dmradas.co.uk
Radio Astronomy – Part 2 BAperture Synthesis • Obtaining radio ‘pictures’ • By using multiple antennas with variable baselines it is possible to ‘synthesise’ the performance of a very large single dish • Radio Telescopes use Aperture Synthesis to give ‘Radio Pictures’ • The ultimate system is the Square Kilometre Array SKA • Partly operational in 2015 • Fully on line in 2020 • This is subject of Part 2 B SKA Website - dmradas.co.uk