Download
1 / 29
290 likes | 446 Vues
Oral Health Disparities in Publicly Insured Children. Dental Advisory Committee April 11 th , 2008 Tegwyn H. Brickhouse DDS PhD Department of Pediatric Dentistry VCU School of Dentistry. Grant. NIH Career Transition Award (K22)

E N D
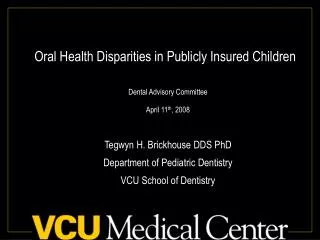
Oral Health Disparities in Publicly Insured Children Dental Advisory Committee April 11th, 2008 Tegwyn H. Brickhouse DDS PhD Department of Pediatric Dentistry VCU School of Dentistry
Grant • NIH Career Transition Award (K22) • From the National Institutes of Dental and Craniofacial Research • Supports young investigators in their early career • Experience guides them to become a independent scientist • Future grants
Oral Health Disparities • Dental caries is the most common chronic disease of childhood, affecting 58% of all children. • Untreated dental caries has been identified as the most prevalent unmet health need in US children. • Disparities exist among children with 25% suffering 80% of all tooth decay. • Dental disease disproportionately affects children younger then 6, from lower socioeconomic backgrounds. SGR on Oral Health May, 2000
Health Coverage for Children • Employer/Private Insurance 60% • 47 million children • Medicaid/SCHIP 28% • 22 million children • Uninsured 12% • Over 9.4 million Kaiser Commission on Medicaid and the Uninsured September, 2007
Background • Publicly Financed Health Plans Providing Dental Services • Medicaid • A joint federal-state-county program established in 1965 to provide health insurance to low-income populations • State Children’s Health Insurance Program (SCHIP) • A joint federal-state program established in 1997 to provide coverage to low-income uninsured children who are not eligible for Medicaid.
Grant Objectives • Examine thestructure of public dental insurance programs and patterns of Enrollment in publicly insured children. • Examine the Process of dental care (utilization, mix of services) and dental health status Outcomes (tooth loss, caries-related treatments). • Compare dental treatment with of general anesthesia versus the conventional dental delivery system for preschool-aged children • Implement a project that examines outcomes for case management of infant oral health in a medical setting.
Effects of Public Insurance on Access to Dental Services • Cohort of Publicly Insured Children • Enrollment and Claims data from 2002-2005 • Children 0-18 years of age • Two State Programs (Virginia and North Carolina) • Similar size • Similar population distribution • Similar geography
Analytical File Construction • Claim summaries of utilization • Provider-Level summaries • Individual Child-level files • linked enrollment and claims across time periods.
Analytical File Creation Child-Level File Provider Characteristics Enrollment Claims Child
Enrollment Patterns of Publicly Insured Children • Measures that characterize enrollment in public programs • Length of Enrollment (duration) • Heterogeneous populations • Patterns of Enrollment (continuity) • yearly and age determinations • gaps
Impacts of Enrollment • Impact on eligibility for dental services • Age and aid categories of eligibility determination • Enrollees are approximately 10% SCHIP, 90% Medicaid • 75% of children were enrolled with one MCO provider • 20% enrolled with 2 MCO’s • 5% enrolled with 3+ • Impact on provider acceptance • Real-time eligibility determination (on-line, swipe methods)
Enrollment • Over the 3 year period, children were enrolled a mean number of 436 days, median of 365 days. • The mean age of enrolled children is 5 years. • 12.5% had no gaps in enrollment • 50% has one gap in enrollment • 37.5% had 2+ gaps in enrollment • Few studies have examined the relationship of enrollment patterns and utilization.
Outcomes • Dental Visits • Utilization of dental services measured by at least one paid claim. • Annual Dental Visit (NCQA standards) • Performance Measures of Dental Services • Which children utilize services/benefit most • Age • Geography • Income
Outcomes • Performance Measures of Dental Services • Preventive services • Restorative services • Tooth Loss (receipt of one or more extraction services) • Dental Home • 2 visits to same practice/same year
Mix of Services for all Children *Likelihood of having a dental service compared to Medicaid (ref), controlling for enrollment characteristics, age, race, and county-level indicators.
Mix of Services for Children Accessing Dental Care *Likelihood of having a dental service compared to Medicaid (ref), controlling for enrollment characteristics, age, race, and county-level indicators.
Preventive Restorative Extraction Predicted probabilities of dental services (preventive, restorative, and extraction) for North Carolina children (4 years of age) enrolled for 12 months.
Virginia Claims Data • 62% of dental claims were MCO • 38% of dental claims were FFS • Mean age for children with claims was 9 years of age.
Mix of Services • 32% Diagnostic Services • 40% Preventive Services • 18% Restorative Services • 5% Extraction Services • 1.5 % Orthodontic Services
Infant Oral Health Project • Preventive oral health services consist of • knee to knee oral screening and risk assessment • Fluoride varnish • oral health education for caregivers • referral to a pediatric dental clinic.
Infant Assessment • 19% of children had signs of dental caries • 12.5% having white-spot lesions • 75% were categorized as ‘high’ risk and referred for a dental visit • 80% of children received a fluoride varnish treatment
High-Risk Children • 6-months post-enrollment, 9% of children had made a dental visit to VCU. • Children with visible plaque were more likely to have decay at baseline. • 400+ Children enrolled in the VCU Bright Smiles Program • Examine the prevalence of dental claims for enrolled children versus a random sample of Medicaid children 0-3 years of age.
Future Studies • Provider Measures • Participation in programs • Level of activity • Types of Services • Response to program changes • Program structure • Fee increases
State Program Reform • Single Vendor Carve Out • Pre-Post Design
Questions? • Many Thanks to DMAS • Sandra Brown • James Starkey • Lisa Bilik • Pat Finnerty