2. Point Cloud x, y, z, …
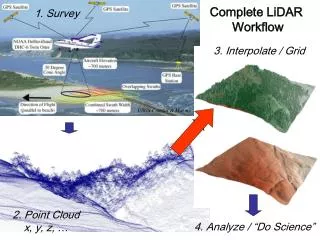
Complete LiDAR Workflow. 1. Survey. 3. Interpolate / Grid. USGS Coastal & Marine. 2. Point Cloud x, y, z, …. 4. Analyze / “Do Science”. The Challenge of Community LiDAR data. LiDAR coverage of the southern San Andreas and San Jacinto faults. - ~ 3.7 billion LiDAR returns, ~1.9 TB

2. Point Cloud x, y, z, …
E N D
Presentation Transcript
Complete LiDAR Workflow 1. Survey 3. Interpolate / Grid USGS Coastal & Marine 2. Point Cloud x, y, z, … 4. Analyze / “Do Science”
The Challenge of Community LiDAR data LiDAR coverage of the southern San Andreas and San Jacinto faults - ~ 3.7 billion LiDAR returns, ~1.9 TB - Very high-res., supports 25-50 cm DEMs
The Challenge of Community LiDAR data cont. National LiDAR Initiative Rough calculation using a NASA high elevation acquisition approach: Land area of US = 9,161,923 sq km Assuming: • 2 laser pulses per sq meter • an average of 1.5 returns per pulse • 35 data bytes per return • = 1 x 10 • 15 bytes of point cloud data • = 1 petabyte (1,000 terabytes) “For comparison, that is 3 times more data than produced by all the instruments combined on NASA’s flagship Earth Observing System Satellite, Terra (ASTER, MODIS etc.) , over the course of a full year.” Stoker et al., 2007, Report of the First National Lidar Initiative Meeting, February 14-16, 2007, Reston, Va., U.S.G.S. Open File Report, 2007-1189.
Multi-institution collaboration between IT and Earth Science researchers • Funded by NSF “large” ITR program • GEON Cyberinfrastructure provides: • Authenticated access to data and Web services • Registration of data sets and tools, with metadata • Search for data, tools, and services, using ontologies • “GEON was designed as an equal collaboration between Information Technology (IT) and Geoscience researchers, with the goal of developing an enabling IT platform to facilitate the next generation of Geoscience research.” • Scientific workflow environment • Data and map integration capability • - Visualization and GIS mapping Distributed Network GEON / ASU node
The Vision: Conceptual GEON LiDAR Workflow • Utilize cyberinfrastructure developed by GEON to offer online data distribution, DEM generation, and analysis of large LiDAR datasets. • Completely internet-based workflow: • Point cloud to visualization • Utilize modular web services to complete a variety of processing and analysis tasks. • Offer users control of processing and analysis parameters.
Current GLW Status Source: Datasets online: • Northern San Andreas Fault • West Rainier Seismic Zone • E. California Shear Zone (Mike Oskin, UNC, PI) 4. Full B4 Dataset (Southern SAF and SJF) Total of ~6.4 billion LiDAR returns available via GLW Use Statistics • ~43 billion returns processed • 2103 unique jobs submitted • 118 registered GLW users
A cyberinfrastructure-based model for integrated access to community LiDAR datasets