Download
1 / 61
660 likes | 937 Vues
Failure Modes & Effects Analysis (FMEA) A Great Tool to Improve Product and Process Reliability and Reduce Risks. Anthony Tarantino PhD, Six Sigma Master Black Belt, CPIM, CPM, Sr. Advisor to Cisco’s Six Sigma Center of Excellence Adjunct Professor of Finance, Santa Clara University

E N D
Failure Modes & Effects Analysis (FMEA)A Great Tool to Improve Product and Process Reliability and Reduce Risks Anthony Tarantino PhD, Six Sigma Master Black Belt, CPIM, CPM, Sr. Advisor to Cisco’s Six Sigma Center of Excellence Adjunct Professor of Finance, Santa Clara University May 23, 2011
A Leading Six Sigma Authority: “To me Failure Modes and Effects Analysis (FMEA) is a versatile, powerful, process centered tool that belongs in every Process Owners’ and Six Sigma practitioners’ toolbox."
A Leading Operational Risk Authority: “Catastrophic failures in operational risk management are rarely caused by a single and major point of failure. Rather they are the cumulative effect of smaller and inter-related failures. …FMEA is the tool of choice to address these complex operational risk failures at any level of an organization, whether tactical, strategic, or enterprise-wide. It works in every type of organization.”
Objectives The objectives for this session include: • Understand what a FMEA is, why it is used, and when it can it be deployed • Understand the different components, definitions, and calculations used in a FMEA • Learn the steps to developing a FMEA • Use examples and Case Studies to showcase FMEA in action: • Purchasing Process in Finance • Sample High Tech Project to Reduce RMA Rates • San Bruno Gas Pipeline Explosion
Reliability Defined Product reliability is one of the qualities of a product. Quite simply, it is the quality which measures the probability that the product or device “will work.” As a definition: • Product reliability is the ability of a unit to perform a required function under stated conditions for a stated period of time. And, correspondingly, quantitative reliability, as a definition, is: • Quantitative reliability is the probability that a unit will perform a required function under stated conditions for a stated time. Source: Fergenbaum, A. V. (1991). Total Quality Control. New York: McGraw-Hill, Inc.
When Reliability is Lacking - Categories of Failure Mode Safety • Any failure mode that directly affects the ability of a product to meet Federal Safety Standards, or creates a potential product liability issue, or can result in death or extensive property damage. Major (Hard) • Any failure mode that stops the operation of a product or system which requires immediate repair. • Evidenced by a catastrophic event, i.e, TEPCO Nuclear Plant Meltdown • Failure mechanism might be due to a “shock” to the system or an accumulation of shocks to the system Minor (Soft) • Any failure mode that results in a product from meeting one of its intended functions, but does not preclude it from satisfying its most important functions. • Any failure mode which results in a gradual but not complete ability of the product to meet its intended function. • Degradation of performance over time, wear are examples of soft failures.
FMEA Defined What is a Failure Modes & Effects Analysis? • A FMEA is a systematic method to: • Recognize, evaluate, and prioritize (score) potential failures and their effects • Identify actions which could eliminate or reduce the chance of potential failure occurring • Document and share the process • FMEA generates a living document that can be used to anticipate and prevent failures from occurring. • In DMAIC and Design For Sigma Projects, FMEA’s can be used in various stages and revised as the project moves forward.
Why Use a FMEA • Use of quality tools such as Statistical Process Control (SPC) encourage the use of FMEA(s) to help problem-solve quality problems • ISO/QS 9000 and product liability directives of the EC 1985 strongly encourage its use. • Helps select alternatives (in system, design, process, and service) with high reliability and high safety potential during the early phases (Blanchard 1986) • Ensures that all conceivable effects on operational success have been considered. • Many risk management regimens and standards, such as ISO 31000/31010 used in finance and operations are based on FMEA logic – probability vs. severity scoring and matrix.
Why Use a FMEA - Continued • Improves the quality, reliability and safety of products and processes in a proactive manner. • Helps to increase customer satisfaction, by proactively addressing failures that keep us from meeting critical customer requirements in processes or products. • Reduces product development timing and cost • Reduces operational risk • Documents and tracks actions taken to reduce risk; Prioritize areas of focus
FMEA is a Team Process Team Formation • Product Development • Design • Manufacturing • Quality • Sales/Marketing • Suppliers • Reliability and testing Team Roles • Facilitator • Champion • Recorder/librarian 6-10 members is optimal What are your experiences in FMEA Teams?
Why Use a Team for FMEA Team decision-making takes time. For a team to reach consensus: • 100 percent active (express agreement/disagreement) participation. • Participants must be open to new ideas/to influence others. • 100 percent agreement not the goal. Majority does not rule. Sometimes a single individual may be on the right track. • Need a formal system for voting. • Need effective facilitator (leader). Team process check (how did we do?) • Difficult individuals • Facilitator must resolve such instances. Effective meeting skills • Planning the meeting Effective problem-solving skills Soft Skills Are Critical
The Primary Driver for FMEA - What does 99.9% Quality Mean? • 268,500 defective tires shipped per year • 500 incorrect surgical operations performed each week • Two million documents lost by the IRS per year • 880,000 credit card magnetic strips with the wrong information • 19,000 newborn babies dropped at birth by doctors each year • 22,000 checks deducted from the wrong account each hour • One hour of unsafe drinking water • 291 incorrect pacemaker operations per year • 12 babies given to the wrong parent each day • Two unsafe landings at O’Hare Airport per day • Your heart fails to beat 32,000 times per year • 6,000 lost pieces of mail per hour • 20,000 incorrect drug prescriptions per year • 107 incorrect medical procedures performed daily • 14,208 defective personal computers shipped each year
Elements of a Successful FMEA 1. All problems are not the same. This is perhaps the most fundamental concept in the entire FMEA methodology. Unless a priority of problems (as a concept) is recognized, workers are likely to be contenders for chasing fires. They will respond to the loudest request and/or the problem of the moment. (In other words, they will manage by emergency.) - Does this sound like your organization? 2. The customer must be known. Acceptance criteria are defined by the customer, not the engineer. 3. The function must be known. 4. One must be prevention (proactively) oriented. Unless continual improvement is the force that drives the FMEA, the efforts of conducting FMEA will be static. The FMEA will be conducted only to satisfy customers and/or market requirements to the letter rather than the spirit of the requirements. Unfortunately, this is a common problem in implementation of an FMEA program.)
Sample FMEA Form What actions will you take? What could cause the failure? Describe the impact Process Step Is there anything in place to detect or stop this from happening? Describe how the process step could go wrong Rankings (1-10)
History of the FMEA • 1940s - First developed by the US military in 1949 to determine the effect of system and equipment failures • 1960s - Adopted and refined by NASA (used in the Apollo Space program) • 1970s – Ford Motor Co. introduces FMEA after the Pinto affair. Soon adopted across automotive industry • Today – FMEA used in both manufacturing and service industries
Types of FMEAs • Design FMEA - examines the functions of a component, subsystem or main system. • Potential Failures: incorrect material choice, inappropriate specifications. • Example: Air Bag (excessive air bag inflator force). • Process FMEA - examines the processes used to make a component, subsystem, or main system. • Potential Failures: operator assembling part incorrectly, excess variation in process resulting in out-spec products. • Example: Air Bag Assembly Process (operator may not install air bag properly on assembly line such that it may not engage during impact).
Definitions Failure Mode • The way in which the product or process could fail to perform its intended function. • Failure modes may be the result of upstream operations or inputs, or may cause downstream operations or outputs to fail. Failure Effects • The outcome of the occurrence of the failure mode on the system, product, or process. • Failure effects define the impact on the customer. • Ranking is translated into “Severity” score
Definitions Failure Causes • Potential causes or reasons the failure mode could occur • Likelihood of the cause creating the failure mode is translated into an “Occurrence” score Current Controls • Mechanisms currently in place that will detect or prevent the failure mode from occurring • Ability to detect the failure before it reaches the customer is translated in “Delectability” score
Linking Causes to Effects One to One, One to Many, Many to One, or Many to Many Cause 1 Effect 1 1:1 1:M Cause 2 Effect 2 Effect 1 Cause 1 Effect 2 M:1 Cause 1 Effect 1 Cause 2
CalculationsRisk Priority Number The Risk Priority Number (RPN) identifies the greatest areas of concern. RPN is the product of: (1) Severity rating (2) Occurrence rating (3) Detection rating
Calculations - FMEA Variables • Severity • A rating corresponding to the seriousness of an effect of a potential failure mode. (scale: 1-10. 1: no effect on the customer, 10: hazardous effect) • Occurrence • A rating corresponding to the rate at which a first level cause and its resultant failure mode will occur over the design life of the system, over the design life of the product, or before any additional process controls are applied. (scale: 1-10. 1: failure unlikely, 10: failures certain) • Detection • A rating corresponding to the likelihood that the detection methods or current controls will detect the potential failure mode before the product is released for production for design, or for process before it leaves the production facility. (scale: 1-10. 1: will detect failure, 10: almost certain not to detect failures)
Calculations - Risk Priority Number (RPN) Severity x Occurrence x Detectability = Risk Priority Number (RPN) For a given potential failure mode, how bad the outcome is multiplied by how likely it would actually happen multiplied by what things are in place today to prevent or notice it before it happens.
FMEA Process 2 For each step, brainstorm potential failure modes and effects 1 Start with the process map Determine severity Determine the potential causes to each failure mode Determine likelihood of occurrence 3 Determine detectability Evaluate current controls 4 5 6 Identify actions Determine RPN
When is a FMEA Started? • As early as possible; that is, as soon as some information is known (usually through a QFD). • Practitioners should not wait for all the information. If they do, they will never perform a FMEA because they will never have all the data or information. • When new systems, designs, products, processes, or services are designed. • When existing systems, designs, products, processes, or services are about to change regardless of reason. • When new applications are found for the existing conditions of the systems, designs, products, processes, or services.
When is a FMEA Completed? • Only when the system, design, product, process, or service is considered complete and/or discontinued. • A System FMEA may be considered finished when all the hardware has been defined and the design is declared frozen. • A Design FMEA may be considered finished when a release date for production has been set. • A Process FMEA may be considered finished when all operations have been identified and evaluated and all critical and significant characteristics have been addressed in the control plan. • A Service FMEA may be considered finished when the design of the system and individual tasks have been defined and evaluated, and all critical and significant characteristics have been addressed in the control plans. • As a general rule, the FMEA should be available for the entire product life. The FMEA is a working document.
FMEA Tips • No absolutes rules for what is a high RPN number. Rather, FMEA often are viewed on relative scale (i.e., highest RPN addressed first) • It is a team effort • Motivate the team members • Ensure cross-functional representation on the team • Treat as a living document, reflect the latest changes • Develop prioritization with the process owners! • Assign an owner to the FMEA; ensure it is periodically reviewed and updated
FMEA & The DMAIC Lifecycle Q: At what phase can/should the FMEA be used in a DMAIC project? A: A FMEA can be used in most phases of the DMAIC lifecycle for various purposes • How it can be used: • Project selection • Project scope • How it can be used: • Understand the process (w/ process mapping) • How it can be used: • Identify process variables / root cause analysis • How it can be used: • Assist with new process development / understand failures in design • How it can be used: • Manage and control the process on an ongoing basis FMEA can also be used in each stage of Design for Six Sigma - DMADV
ExamplePurchasing Dept. Complete Purchase Requisition (PR) customer Focus Team Send PR to Purchasing Dept. Incorrect PR Returned Correct and Send Back Receive Goods Start No Yes Form Correct Receive PR Complete P.O. Send P.O. To supplier Purchasing Department Confirm receipt of P.O. Complete Commit Process Ship Goods Supplier
ExamplePurchasing Dept. From the process map, list the process steps Brainstorm the various ways the step could fail
ExamplePurchasing Dept. Determine the severity ranking using the scale Determine the potential effects
ExamplePurchasing Dept. Determine the potential causes Determine how likely the failure would occur due to this cause
ExamplePurchasing Dept. Determine how likely the controls in place will detect or prevent the failure mode from occurring Identify what controls or measures are currently in place
ExampleCalculate the RPN Severity RPN Occurrence Detectability 5 x 4 x 3 = 60
Occurrence Reduced from 4 to 3. PRN cut in half. ExamplePurchasing Dept. FMEA owner & team update the document as actions are complete Recalculate the RPN after actions are complete Assign specific owners Brainstorm potential actions that will lower the RPN
Case Study: Using a FMEA Hybrid –Adding Project Prioritization Index (PPI) PPI can be used in combination with FMEA to score problem solvingprojects by balancing potential savings against project costs, and project effort/duration against project risks (chance of success). PPI consists of four metrics: • Project Costs ($) • Project Benefits ($) • Project Probability of Success (Percent) • Project Duration (Years) The PPI formula balances: • Project Benefits versus Project Costs • Project Probability of Success versus Project Duration The formula looks like this: PPI = (Benefits/Costs) x (Probability of Success/Project Duration) Source: Praveen Gupta, Total Quality Management, in Anthony Tarantino, Risk Management in Finance: Six Sigma and Other Next Generation Techniques (Wiley and Sons, 2010)
Case Study: Using a FMEA Hybrid - Adding Project Prioritization Index (PPI)
Case Study: Using FMEA+PPI To Score Potential Problem Solutions
Play the Youtube VOD from CBS News http://www.youtube.com/watch?v=EZ6YbUrnxVM
San Bruno, CA - September 10, 2010 The ruptured natural gas pipeline created a crater approximately 72 feet long by 26 feet wide. A pipe segment approximately 28 feet long was found about 100 feet away from the crater. The released natural gas was ignited sometime after the rupture; the resulting fire destroyed 37 homes and damaged 18. Eight people were killed, numerous individuals were injured, and many more were evacuated from the area. Source: http://www.ntsb.gov/surface/pipeline/preliminary-reports/san-bruno-ca.html
Loss of Power at Control Terminal Just before the accident, PG&E was working on their uninterruptable power supply (UPS) system at Milpitas Terminal, which is located about 39.33 miles SE of the accident site. During the course of this work, the power supply from the UPS system to the supervisory control and data acquisition (SCADA) system malfunctioned so that instead of supplying a predetermined output of 24 volts of direct current (VDC), the UPS system supplied approximately 7 VDC or less to the SCADA system. Because of this anomaly, the electronic signal to the regulating valve for Line 132 was lost. The loss of the electrical signal resulted in the regulating valve moving from partially open to the full open position as designed. The pressure then increased to 386 psig. The over-protection valve, which was pneumatically activated and did not require electronic input, maintained the pressure at 386 psig. Source: http://www.ntsb.gov/surface/pipeline/preliminary-reports/san-bruno-ca.html
Case Study: San Bruno Gas Pipeline Explosion There were longitudinal fractures in the first and second pup of the ruptured segment and a partial circumferential fracture at the girth weld between the first and second pup. There was a complete circumferential fracture at the girth weld between the fourth pup in the ruptured segment and the fifth pup in the north segment. Source: http://www.ntsb.gov/surface/pipeline/preliminary-reports/san-bruno-ca.html
Case Study: San Bruno Gas Pipeline Explosion The longitudinal fracture in the first pup continued south into the pipe ending in a circumferential fracture in the middle of the pipe. Source: http://www.ntsb.gov/surface/pipeline/preliminary-reports/san-bruno-ca.html
Poor Document and Records Retention SAN FRANCISCO (AP) March 5, 2011 – Facing a state Public Utilities Commission order to produce records on its pipelines by March 15. the utility has been shipping pallets loaded with boxes of documents to the Cow Palace in Daly City, where PG&E employees are pouring through the paper records. “This effort is an example of the level of commitment the company is putting forward to make sure this process is thorough and complete,” PG&E spokesman Paul Moreno said. …it was part of a 24-hour search by more than 300 employees. The document search comes after investigators found a seam with inferior welds that was believed to be the origin of the blast. PG&E’s computer records had shown the pipeline did not have a seam, but PG&E officials have acknowledged problems when the old paper records were incorporated into the utility’s computer system. PG&E President Chris Johns said last month the utility had been unable to find documents for 30 percent of its 1,000-plus miles of pipeline running under urban areas.


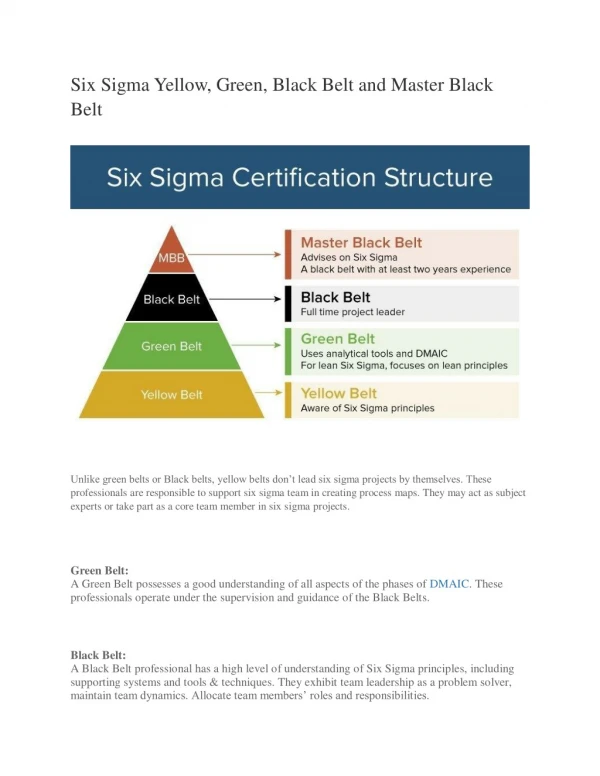
![Six Sigma [Green Belt Project]](https://cdn0.slideserve.com/646243/six-sigma-green-belt-project-dt.jpg)