
Multi-Wavelength Helioseismology: Power and Phase Maps in Solar Active Region NOAA 11072
This study presents the analysis of solar acoustic waves in the active region NOAA 11072, utilizing data from the Helioseismic and Magnetic Imager (HMI) and Atmospheric Imaging Assembly (AIA). It investigates the power, coherence, and phase differences of oscillations across various wavelengths, revealing significant effects of magnetic fields on wave behavior. The results indicate that acoustic waves show modified power distributions and phase shifts, particularly in regions with concentrated magnetic fields, enhancing our understanding of solar atmospheric dynamics.

Multi-Wavelength Helioseismology: Power and Phase Maps in Solar Active Region NOAA 11072
E N D
Presentation Transcript
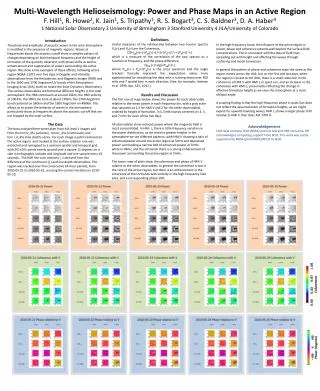
Multi-Wavelength Helioseismology: Power and Phase Maps in an Active RegionF. Hill1, R. Howe2, K. Jain1, S. Tripathy1, R. S. Bogart3, C. S. Baldner3, D. A. Haber41 National Solar Observatory 2 University of Birmingham 3 Stanford University 4 JILA/University of Colorado Definitions Useful measures of the relationship between two Fourier spectra PA(n) and PB(n) are the Coherence, COHAB(n)=|<PAB(n)>|/[<|PA(n)|2><|PB(n)|2>], which is a measure of the correlation of the two spectra as a function of frequency, and the phase difference, dfAB(n)=arg[<PAB(n)>], where PAB(n) ≡ PA(n)P*B(n) is the cross spectrum and the angle brackets formally represent the expectation value, here approximated by smoothing the data with a running mean over 300 mHz and 7 spatial bins in each direction. (See, for example, Jiménez et al. 1999, ApJ, 525, 1042.) Results and Discussion The first row of maps below shows the power for each observable relative to the mean power in each frequency bin, with a gray scale that saturates at 1.3 for HMI V and 2 for the other observables), ordered by height of formation, in 0.3 mHz bands centered on 3, 5, and 7 mHz for each of the five days. All observables show reduced power where the magnetic field is most concentrated. In HMI ICthere is little frequency variation in the power distribution; as we move to greater heights in the atmosphere we see different patterns, with HMI V showinga halo of enhanced power around the active region at 5mHz and depressed power surrounding a narrow belt of enhanced power at 7mHz, while in HMI IL and the UV bands there is a strong enhancement of the power surrounding the active region at 7mHz. The lower rows of plots show the coherence and phase of HMI V relative to the other observables. In general the coherence is low in the core of the active region, but there is an enhancement in the coherence of the UV bands with velocity in the high-frequency halo area, and a corresponding phase shift. Introduction The phase and amplitude of acoustic waves in the solar atmosphere is modified in the presence of magnetic regions. Waves at frequencies above the acoustic cutoff show a complex pattern of changes depending on both temporal frequency and the height of formation of the quantity observed, with phase shifts as well as enhancement and suppression of power surrounding the active region. We show some examples of these effects, following active region NOAA 11072 over five days in Doppler and intensity observations from the Helioseismic and Magnetic Imager [HMI] and in the 1600 and 1700 Angstrom UV bands of the Atmospheric Imaging Array [AIA], both on board the Solar Dynamics Observatory. The various observables are formed at different heights in the solar atmosphere: the HMI continuum at around 20km, the HMI velocity at 100 km, the HMI Line Core at about 270km, the 1700 Angstrom band centered on 360km and the 1600 Angstrom on 480km. This allows us to probe the behavior of waves in the atmosphere, particularly those at frequencies above the acoustic cut-off that are not trapped by the solar surface. The Data The data analyzed here were taken from AIA level 1 images and from the hmi.V_45s (velocity) , hmi.Ic_45s (continuum) and hmi.Ld_45s (line depth) series. For each image a patch centered on the active region and tracked at the surface rotation rate was extracted and remapped to a common spatial and temporal grid, with 201×201 points evenly spaced over a square 15 degrees on a side in heliographic latitude and longitude and one sample every 45 seconds. The HMI line core intensity ILis derived from the difference of the continuum (IC) and line depth observables. The region was tracked over five consecutive 24-hour periods, from 2010-05-21 to 2010-05-25, crossing the central meridian on 2010-05-23. In the high-frequency band, the influence of the active region in power, phase and coherence extends well beyond the surface field concentrations. This is consistent with the idea of field lines spreading out with height and affecting the waves through scattering and mode conversion. In general the pattern of phase and coherence stays the same as the region moves across the disk, but on the first and last days, when the region is closest to the limb, there is a small reduction in the coherence of HMI V with HMI IL in quiet sun, and an increase in the coherence with HMI IC, presumably reflecting the change in effective formation height as we view the atmosphere at a more oblique angle. A puzzling finding is that the high-frequency phase in quiet Sun does not reflect the assumed order of formation heights, as we might expect for upward-traveling waves; HMI IL shows a larger phase shift relative to HMI V than does AIA 1700 Å. Acknowledgements SDO data courtesy SDO (NASA) and the AIA and HMI consortia. RH acknowledges computing support from NSO. This work was partly supported by NASA grant NNH12AT11I to NSO.


