Unit 3 Assessment Re-take
Unit 3 Assessment Re-take. NO TALKING Must label each section on separate piece of paper Can redo all questions Must staple retake to front of original and turn in by end of class NO EXCEPTIONS. Unit #4. Regions for High School. Summary of Unit.

Unit 3 Assessment Re-take
E N D
Presentation Transcript
Unit 3 Assessment Re-take • NO TALKING • Must label each section on separate piece of paper • Can redo all questions • Must staple retake to front of original and turn in by end of class • NO EXCEPTIONS
Unit #4 Regions for High School
Summary of Unit • This unit will serve as a vehicle for teaching Geography Standard 4- Regions for grades 9-12. It is intended to stand alone, but is also incorporated into the Delaware Recommended Curriculum Regional Planning Course. An optional culminating activity for the Regional Planning course is included in this unit plan as an extension of the performance task. The unit consists of three lessons: Lesson One: Defining Spaces will clarify definitions of types of regions and explore practical applications of regions as models that help us understand the world better. This lesson will review the advantages and disadvantages of natural or physical boundaries, surveyed boundaries, and also methods of statistically dividing space. Lesson Two: Infant Mortality is from the Delaware Health Initiative CD. This lesson gives students practice in boundary setting in the context of providing access to health care. Lesson Three: Planning in Your Own Backyard encourages students to examine and evaluate plans in place right now in the areas where they live or attend school.
Summary of Unit • Geography standard four at the high school level calls for an understanding of how to use regional analysis. The key to such analysis requires identifying the boundaries of regions, for without boundaries a region cannot exist. Formal regions require precise boundaries and many political units are formal regions. Students should recognize the ways that formal regional boundaries have been drawn, and the advantages and disadvantages of each. For instance, the use of physical features such as rivers or the crests of mountains raises a number of issues. Where does the boundary go between the peaks of a mountain range? Should the boundary use the center of a river and, if so, what happens when the river changes its course? The use of human features can have similar consequences. Many boundaries have followed survey lines such as compass headings or lines of latitude or longitude. While they have the value of precision, they often ignore and cut across the much more complex boundaries of human culture, as in much of Africa.
Summary of Unit • Within the boundaries of formal regions, characteristics or conditions are uniformly distributed. For example, all businesses and individuals within the boundaries of the United States, whether they are near the capital or far from it, are subject to the same laws, pay the same federal taxes, and enjoy the same protections of civil liberties. Planners must be aware of and accommodate the requirements, codes, restrictions, goals and incentives that apply in formal political jurisdictions within their region. • Functional regions pose equal difficulties. Where a region’s influence declines over a zone, placing the boundary is often arbitrary: at what point is the region’s influence sufficiently diminished? Students need to recognize the value of simple statistical techniques to solve this problem, such as the use of Theissen polygons that place a boundary at the mid-point between two regional centers. Such solutions are often used to equitably distribute needed facilities within a region. In this unit the functional metropolitan region and its sub-regions (for example, shopping centers, industrial areas, and residential neighborhoods) will be examined through the planners lens.
Summary of Unit • A second aspect of the standard calls for students to understand how to use regions in solving societal problems. For instance, the location of hospitals relative to the population served often results in some people having better access to services than others. Determining the regional service boundaries of hospitals in the state demonstrates that fact and can point to areas where the population is poorly served. • A final aspect of the standard calls for students to recognize that regions and their boundaries are not always permanent, since the conditions that created them may have changed over time. For instance, the regional boundaries of Native American tribes prior to European settlement were severely disrupted or obliterated after many Native American groups were forcibly moved from their original lands. On the other hand, in Northern Canada, assertion of Native American rights has produced a new set of regional self-governing territories, such as Nunavut. Similarly, the European Union is actively seeking to create a single region out of what were once 25 independent states. Planners know that the use of trolleys, trains and motor vehicles in commuting to work has resulted in an expansion of the city’s influence far beyond its formal “city limits”, often leading to annexation and wholesale incorporation of suburbs into the city itself.
Standard 4 • GEOGRAPHY STANDARD FOUR: Students will develop an understanding of the character and use of regions and the connections between and among them. • Students will apply knowledge of the types of regions and methods of drawing boundaries to interpret the Earth’s changing complexity.
Big Ideas • Regional analysis • Types of boundaries; methods of determining borders • Regionalization can solve problems Unit Enduring Understanding • A region is a concept rather than a real object on the ground, used to simplify the diversity of places. • Planners solve problems by allocating space and managing movement between regions. • There are advantages and disadvantages associated with any real or abstract feature used to draw a boundary
Unit Essential Questions • How might regional analysis help to solve societal problems? • To what extent are regional boundaries permanent? What might cause them to change over time?
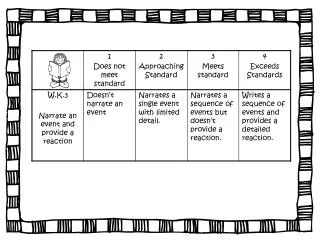
Knowledge and Skills • Students will know… • Formal, physical and functional regions • Advantages and disadvantages of various types of borders and boundaries • Methods of drawing limits of regions • Factors that can influence the effectiveness of boundaries. • Students will be able to… • Regionalize based on available data • Identify reasons why existing boundaries may either contribute to or ease tensions for people in the area.
Lesson One – Defining Spaces • Lesson Essential Question: How do people use and define spaces to help them understand the world? • Vocabulary – Define after lesson Residential, commercial, industrial, agricultural, recreational, public use
Activating Prior Knowledge • Think of a large public gathering where friends or families gather- perhaps for a performance or public event. What are ways people try to define their group’s space, establishing boundaries and also signaling their group identity. • Be prepared to share with class
Defining Spaces • Presents basic terms and concepts of regions • Types of regions • Types of boundaries • Methods used to regionalize data when it is organized in mapped form • PPT
Class Work • Identify and label as many types of land use as possible, outlining the regional boundaries with the pen. Remember that a town or city will often have multiple residential and commercial areas, and they need not be connected. • Create a data list in your notebook • Answer in notebook • What characteristics or features can be observed when walking or driving through the landscape? • To what extent does actual land use match up with the zoning plan?
Class Work • Compare your list with the zoning map of the same area. • To what extend does actual land use match up with the zoning plan? • Zone 46
Checking for Understanding • Describe a property or building that has changed use. • What changes to the property were evidence of a change in use? • Was this change part of a changing boundary for the land use region? Why do you think this?
Homework • Read Standard 4 • Answer questions
Lesson Two: Infant Mortality • Lesson Essential Question: How might regional analysis help to solve societal problems?
Unit Scenario • During the years 1998-2002, Delaware had the sixth highest Infant Mortality rate (IMR) in the United States. Infant Mortality is considered to be a broad measure of a population’s health. The primary causes of infant mortality are the lack of prenatal care that affect the mother’s health, resulting in babies born with very low birth weight. Prenatal care is provided by private physicians or, for those lacking sufficient health insurance, through public and private health clinics. Access to those clinics is a vital part of good prenatal care. A Task Force appointed by Delaware’s Governor developed a proposal published in 2005 to reduce IMR in the state. The recommendations if followed would involve “expanded access to prenatal care through targeted outreach and interventions” and “expanded access to comprehensive reproductive health and family planning services for the uninsured and underinsured”.
Unit Problem • Students take the part of a sub-committee of the Task Force, charged with evaluating the current distribution of public and private prenatal clinics through an analysis of their regional service boundaries, and recommending the location of additional clinics in underserved areas. In particular, they should address the following questions: 1. Where are Delaware’s highest infant mortality levels? 2. How accessible are these areas to existing prenatal service clinics? 3. What are the characteristics of populations (levels of poverty, ethnicity, age and health insurance) in low accessibility areas? 4. What new regional distribution of clinics would better serve the vulnerable population?
Learning Objectives • Understand what is a region and what are the different types of regions. • Understand how regional divisions are constructed for different types of phenomena. • Be able to use regional analysis to solve location problems
Accessing Information • What is infant mortality? • Complete the Student Reading and the accompanying comprehension quiz. • Like many problems that seem to have little to do with maps and globes, the problem of infant mortality in Delaware can benefit from application of geographic analysis. In this case, you will study the geographic question: does where you live affect your access to prenatal care?
Research Step #1 • Before you can address the research questions, you have to examine and change the data to identify which area populations are most likely to experience infant mortality. The data provided are the total number of infant deaths in two five-year periods (1994-1998 and 1999-2003) by census tracts. Census tracts are geographic units that are smaller than zip codes, which have been used for other lesson units. Generally, the smaller the geographic data areas, the more detail we can discover about what we are mapping. Click on census tract map to show where in the state each tract is located (this file may take a short while to load).. Refer back to this map as needed. Note that the numbers used by the U.S. census for each tract are different from those on the map.
Research Step #1 • As you may have learned from other units, the number of infant deaths can be affected by the different numbers of people in an area. To overcome this problem, we usually normalize our data i.e. we would compute a rate for infant mortality to identify the areas with the greatest vulnerability. However, examine the two maps (click infant mortality/numbers) and note from the legend that most of the numerical values for a census tract are under 20.
Research Step #1 • Statistically, numbers less than 20 cannot produce a reliable rate, so in this unit, we cannot determine what the infant mortality rate would be in each tract and we must take a different approach. Look again at the table in your reading. We are going to multiply the state-wide infant mortality rate by the number of live births in each census tract (click maps/live births). This way, we can compute how many infant deaths might occur in each census tract if the statewide infant mortality rate prevailed in each tract. Then, we can look at the actual number of deaths and make maps that show which census tracts have more deaths than predicted. Tracts with the greatest number of deaths above those predicted can be considered the most vulnerable to high levels of infant mortality.
Research Step #1 • Examine the maps of infant mortality variations from prediction (click maps/variations from prediction). Observe that the map legend indicates how many infant deaths exceeded (or fell below) the number predicted. Use the chart (click infant mortality chart or PDF version) to identify the census tracts that fall into the top two categories for each of the time periods. These are the areas where the population is most vulnerable to suffer high rates of infant mortality.
Research Step #2 • Now let us learn something about the nature of those populations. • Click on the population maps (female median age, poverty, race and educational level) and note any associations between tracts that rank high in one or more of these factors and tracts that rank high in vulnerability to infant mortality. Use your infant mortality chart to summarize this information and record the results in your research notebook.
Research Step #3 • Your next step is to conduct a regional analysis of prenatal clinic services in Delaware. Your objective is to see how well-served are the mothers-to-be in the census tracts most vulnerable to infant mortality. • Examine the map of Theissen polygons drawn around the location of each clinic (click map/clinic regions ). You may remember from the second introductory lesson that the polygons enclose all points closer to a given clinic than any other clinic. What is the significance of the variation in the size of the polygons? Write your conclusions in your research notebook about how the size of the polygon may be a measure of the accessibility value of the clinic. If everyone in the state were to be fairly served, how should the size of the polygons vary?
Research Step #4 • Now determine how well served are the populations most vulnerable to infant mortality. • Examine the map that combines the clinic regions with the variation from predicted infant mortality (click map/clinic region-variation from prediction). Identify those census tracts most vulnerable to infant mortality and evaluate how well-served they are by the nearest clinic. Summarize your findings on the infant mortality chart. Use the chart to compare any less well-served vulnerable tracts that also rank high in factors such as median age, poverty, race and education level. Write your observations in your research notebook.
Research Step #4 • Finally, identify where you would place any new clinics so that the populations vulnerable to infant mortality would have a better opportunity to receive prenatal care.
Report to the Task Force • You have now collected enough information to write your report to the Task Force. Remember your task is to recommend where any new clinics should be located. Your answer represents your best judgment – and reasonable people – other students – may come to different conclusions. The most important point to remember is to back up your recommendations with the best possible evidence. Try to be practical. The state does not have unlimited funds. Hard choices have to be made. At best one or two clinics might be opened.
Checking for Understanding • Student Assessment
Homework • Read Standard #4 • Answer questions
Lesson Three: Planning in your own backyard • Lesson Essential Question: How do planners organize data and use regional analysis in their work?
Activating Prior Knowledge • Which is easier, to follow a plan you have made yourself or a plan someone else has made? Why? • Work in pairs • Generate a list of things that must be present in a plan so others can follow it
Research • Access and study maps provided for residents of their local city or county government planning and zoningdepartment. • Go to New Castle Zoning Maps • Take time to become familiar with the detailed map legends and color schemes. • On the map - Locate Christiana High School and your home. (Found at the corner of maps 46, 47, 52 & 53) • In your notebook determine the land use planned for neighborhoods around CHS and the area around your home. Be sure to include the date of the plan and the time span it will be in force.
Research • Answer in notebook - • Who made the present land use plan for their city or county? • Using the resources available individual planners, policymakers, businesses, interest groups and individual citizens who had input into the plan. • What can they find out about the planning process? • What might each “stakeholder” hope to gain from participating in the planning process?
Research • In your notebook - • Evaluate the land use plan based on the attributes you posted at the beginning of the lesson as ideal for a plan. • Does the present county or city plan get an “A”, a “B”- or perhaps an “F”? • What recommendations can you make for the plan itself? • What recommendations can you make for processes to follow?
Milford, DE • Read the two articles on planning in Milford, DE • Take notes in your notebook • Answer the questions in your notebook • Who were the participants in this process? • What steps were included in developing a plan according to the articles?
Class Work • Choose one of these viewpoints: agricultural, commercial developer, naturalist. • What features would you want to see included in a land use plan for your county? • What features would you want to see restricted or eliminated from the list of approved land uses?