Download
1 / 21
210 likes | 223 Vues
This study aims to bridge the gap between mesoscale and neighborhood scale modeling to characterize heat stress in major cities in the US. By utilizing local climate zones and wet bulb globe temperature, the study analyzes heat stress under current and future climate conditions. The findings highlight the impact of intra-urban differences and provide recommendations for heat stress advisories.

E N D
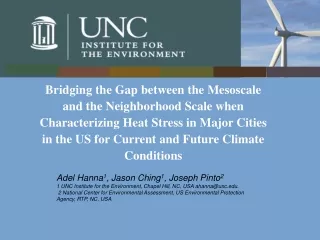
Bridging the Gap between the Mesoscale and the Neighborhood Scale when Characterizing Heat Stress in Major Cities in the US for Current and Future Climate Conditions Adel Hanna1, Jason Ching1, Joseph Pinto2 1 UNC Institute for the Environment, Chapel Hill, NC, USA ahanna@unc.edu. 2 National Center for Environmental Assessment, US Environmental Protection Agency, RTP, NC, USA
Motivation and Objectives Heat Waves Impacts, Metrics and Indices Climate Scenarios Downscaling approach - WRF and CCSM Wet Bulb Globe Temperature (WBGT) Local Climate Zones (LCZs) Utilize LCZ to drive WBGT urban texture within mesoscale model grids cells Demonstrate WBGT variability for Chicago and Atlanta for different climate scenarios Summary of Findings Future Directions and Conclusions Outline
Major global concern regarding the increased frequency and severity of heat waves and their impacts.
Objectives • Provide a modeling platform for bridging the gap between the operational mesoscale modeling and neighborhood scale modeling for characterizing heat stress in two major cities in the US • Integrate highly computational information based on downscaling global climate models to regional models with urban texture parameters mapped based on parameters and their values from Local Climate Zones (LCZs) (Stewart and Oke, 2012) • Compute and analyze heat stress risk levels based on the wet bulb globe temperature(WBGT) under current and future climate conditions • Examine the effect of intra-urban differences on heat stress based on the use of LCZs • Develop recommendations incorporating WUDAPT with operational regional scale modeling for heat stress advisories
Impacts Health, economics, loss of labor hours Introduction of the WBGT as an index for assessing the health impact of heat waves on mortality, morbidity, and comfort. Impact of the occurance and frequency of extreme values of WBGT and its variability geographically and climate changs Why Wet Bulb Globe Temperature (WBGT) A metric that considers dry bulb temperature, wet bulb, and globe temperature The globe temperature is a temperature from a black globe thermometer measuring solar and other ambient radiation to represent the temperature at which heat transfer from the human body is equal to the radiant heat transfer in the actual non-uniform enclosure. Only metric to have defined thresholds Heat Waves
Wet Bulb Global Temperature, WBGT (See Kusaka et al.,(2012)) • WBGT= 0.7WBT + 0.1Td + 0.2 TGlobe • TGlobe= Td + 0.017S - 0.208 U + 0.5 WBT Wet Bulb Temperature Td Dry Bulb Temperature Tglobe Globe temperature S Incoming solar radiation U Wind speed • Applications and correspondence to risk assessment • Developed to help control heat causalities during military training • Correlates better than air temperature to the number of heat strokes patients
WRF model domains Climate Scenarios • Model Years (2003, 2050) • Dynamical downscaling of the CCSM meteorological outputs to provide initial and boundary conditions at 108 km grid resolution for WRF nested at 108-36-12 km grid resolutions • SRES A1B driven CCSM results used for IPCC AR4 on a T85 Gaussian grid. • May, June, July, and August of the years 2003, representing current climate conditions; and the year 2050, representing future climate conditions. • WRF Model hourly outputs at 12km x 12km over USA, can be finer (4km x 4 km) or at even higher resolutions for more refined urban simulations.
Note the expansion of the Bermuda High westward and northward (e.g., 1020mb contours & broadening and strengthening of the warm sectors) CCSM (108km) Monthly average for August
Local Climate Zones (LCZ) (as rendered by the WUDAPT Project) • Table lookup Parameters • Sky View Factor • Building heights • Roughness • Radiative properties • Etc • Each city has its distinctive spatial patterns and distributions of LCZ
WBGT (oC) Heat Stress Risk Levels(Kusaka et al., 2012) Number of hours corresponding to WBGT Range Atlanta Chicago
Cumulative Distribution of WBGT Warming trend in 2050 for both cities is clear The impact on Chicago (in terms of WBGT differences) seem to be larger than Atlanta
WBGT Time Series General warming trend for year 2050 Atlanta shows higher number than Chicago of heat stress related health impacts
Overall increase across the distribution for both cities from 2003 to 2050 Box Plots Median Median
Model sensitivity to grid size & ability to resolving details of underlying surfaces LCZ classes For Chicago 12 km grids 36 km grids The finer the grid mesh, the better to resolve the details of the underlying surfaces, the more appropriate is the model physics applicable to the dominant land features
Urban variation in WBGT sensitivity to its Sky View Factor, SVF Sky View Factor (SVF) Sensitivity of WBGT in terms of its effect on solar radiation on T Globe WBGT= 0.7WBT+0.1Td+0.2 T Globe T Globe= Td + 0.017Swrf - 0.208 U + 0.5 Replacing Swrf with Surban Where Surban= Swrf x SVF (Kusaka et al., 2012) SVF = 0 Sky view completely obstructed SVF = 1 Sky view completely unobstructed (WRF) and U = output of regional model, WRF, or U = 1 msec-1 (for illustration purposes)
Sensitivity of WBGT to Sky View Factor (SVF)actoractor Differences of more than 3.0 are seen particularly during June and July 1/3 the range of concern of heat stress risk levels Significant diurnal variability in WBGT
This Pilot Study was performed; designed to explore the operational feasibility of providing heat stress indices (WBGT) and advisories based on current and mid century climate prediction scenarios for two cities, Chicago and Atlanta Utilized offline outputs of WRF model based on downscaling CCSM under current (Year 2003) and future (Year 2050) climate conditions as input to calculate WBGT time series (May to Aug) Results show higher heat stress in 2050 simulations for both cities Synoptic responses between the base and future year for each city differed during the 4 month period Significant diurnal variation in WBGT and significant range of intra-urban (as subgrid) variability due to the potential range of LCZs (represented by SVF in this case) present in coarse operational grid systems. Summary and Findings
Future Directions and Conclusions • The output of regional modeling results can be used to calculate WBGT on an operational bases • Intra-urban variations in WBGT may be introduced through the utilization of Table Lookup values of parameters of LCZs (especially SVF) superimposed as spatial weighting maps. • Conceptually, the extension of this effort could be extended to provide advisories anywhere in the world. We envision this by the incorporation of WUDAPT Level “0” Census of Cities data. WUDAPT would provide on a worldwide bases. • LCZ and the relevant parameters of the intra-urban heat stress advisories for all major cities in the world • Provisions (through the URBPARM table in WPS/WRF) for urban options to run WRF anywhere in the world, on an operational bases. • Further efforts will be required to test and evaluate the feasibility of these suggestions.
EPA- STAR program Acknowledgments R832751010 Disclaimer: The views expressed are those of the authors and do not necessarily represent views or policies of the U.S. Environmental Protection Agency