Download

1 / 23
230 likes | 316 Vues
Explore the intricate connections of food chains, energy flow, and ecological pyramids in ecosystems. Learn about trophic levels, energy transfer, and pyramid types - energy, numbers, and biomass. Dive into how organisms interact in a dynamic ecosystem!

E N D
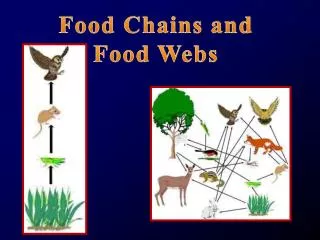
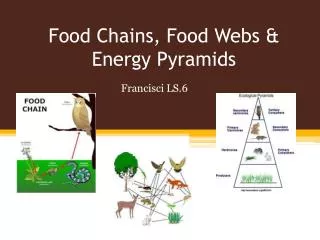
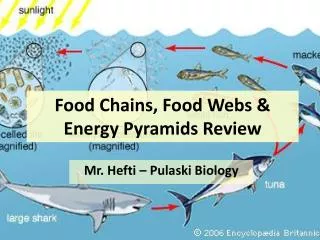
Food Chains • Nutrients and energy flow through ecosystems in food chains and food webs.
A food chain is the flow of energy from one organism to another. • The arrows in a food chain represent the energy flow! • Here is an example……
FOOD WEBS • Interconnecting food chains • Gives us a better picture of the ecosystem
Trophic Levels • Contains all organisms in a feeding level that are the same number of steps away from the sun. • Moving up each trophic level, there is a 90% loss of heat.
That means that only 10% of energy is passed along from one level to another.
Because of the huge loss of energy, there is usually no more that 4 or 5trophic levels.
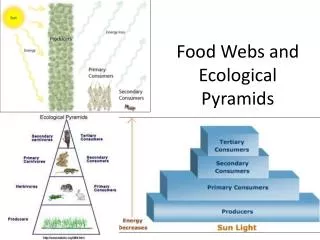
Ecological Pyrmaids • Graphic way to represent the relationship energy values in each tropic level.
TYPES OF PYRAMIDS • Pyramid of Energy • Pyramid of Numbers • Pyramid of Biomass
PYRAMID OF ENERGY • Illustrates the energy content of biomass of each tropic level. • Energy expressed in kilocalories/square meters.
PYRAMID OF BIOMASS • Illustrates the total biomassat each trophic level.
Biomass is a quantitative estimate of the total mass or amount of living material. • Biomass units vary. It can be represented by total volume or live weight.
PYRAMID OF NUMBERS • This pyramid is based on the number of organisms at each level.
Not as useful as the other pyramids because it provides no information about energy levels or biomass.
Blue birds INVERTED PYRAMID OF NUMBERS