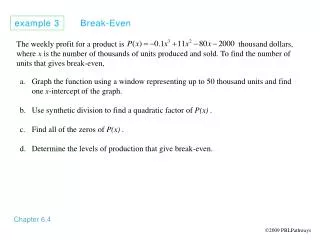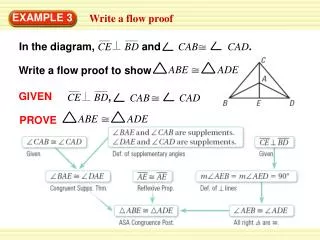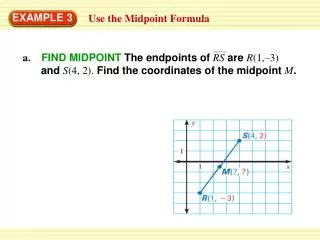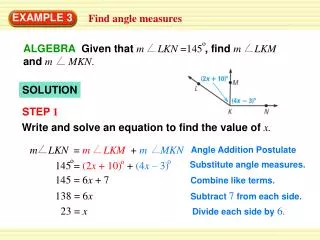
EXAMPLE 3
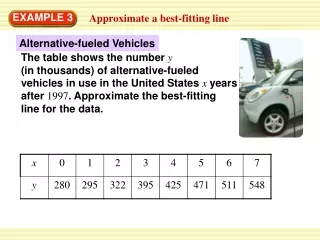
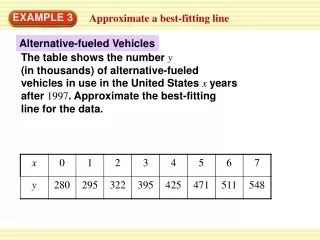
EXAMPLE 3. Approximate a best-fitting line. Alternative-fueled Vehicles. The table shows the number y (in thousands) of alternative-fueled vehicles in use in the United States x years after 1997 . Approximate the best-fitting line for the data. EXAMPLE 3.

EXAMPLE 3
E N D
Presentation Transcript
EXAMPLE 3 Approximate a best-fitting line Alternative-fueled Vehicles The table shows the number y (in thousands) of alternative-fueled vehicles in use in the United States xyears after 1997. Approximate the best-fitting line for the data.
EXAMPLE 3 Approximate a best-fitting line SOLUTION STEP 1 Draw a scatter plot of the data. STEP 2 Sketch the line that appears to best fit the data. One possibility is shown.
248 548 – 300 m = = 41.3 6 7 – 1 EXAMPLE 3 Approximate a best-fitting line STEP 3 Choose two points that appear to lie on the line. For the line shown, you might choose (1,300), which is not an original data point, and (7,548), which is an original data point. STEP 4 Write an equation of the line. First find the slope using the points (1,300) and (7,548).
y 41.3x + 259 ANSWER An approximation of the best-fitting line is y=41.3x+259. EXAMPLE 3 Approximate a best-fitting line Use point-slope form to write the equation. Choose (x1, y1) = (1,300). y – y1 = m(x – x1) Point-slope form y – 300 = 41.3(x – 1) Substitute for m,x1, and y1. Simplify.
y = 41.3x + 259 = 41.3(13) + 259 796 EXAMPLE 4 Use a line of fit to make a prediction Use the equation of the line of fit from Example 3 to predict the number of alternative-fueled vehicles in use in the United States in 2010. SOLUTION Because 2010 is 13 years after 1997, substitute 13 for x in the equation from Example 3.
ANSWER You can predict that there will be about 796,000 alternative-fueled vehicles in use in the United States in 2010. EXAMPLE 4 Use a line of fit to make a prediction
Enter the data into two lists. Press and then select Edit. Enter years since 1997 in L1 and number of alternative-fueled vehicles in L2. EXAMPLE 5 Use a graphing calculator to find a best-fitting line Use the linear regression feature on a graphing calculator to find an equation of the best-fitting line for the data in Example 3. SOLUTION STEP1
Find an equation of the best- fitting (linear regression) line. Press choose the CALC menu, and select LinReg(ax+b). The equation can be rounded to y=40.9x+263. EXAMPLE 5 Use a graphing calculator to find a best-fitting line STEP2
Make a scatter plot of the data pairs to see how well the regression equation models the data. Press [STAT PLOT] to set up your plot. Then select an appropriate window for the graph. EXAMPLE 5 Use a graphing calculator to find a best-fitting line STEP3
ANSWER An equation of the best-fitting line is y=40.9x+263. EXAMPLE 5 Use a graphing calculator to find a best-fitting line STEP4 Graph the regression equation with the scatter plot by entering the equation y = 40.9x + 263. The graph (displayed in the window 0≤x≤ 8 and 200 ≤y≤600) shows that the line fits the data well.
OIL PRODUCTION: The table shows the U.S. daily oil production y(in thousands of barrels) xyears after 1994. 4. a. Approximate the best-fitting line for the data. ANSWER y = –130x + 6710 for Examples 3, 4 and 5 GUIDED PRACTICE
OIL PRODUCTION: The table shows the U.S. daily oil production y(in thousands of barrels) xyears after 1994. 4. b. Use your equation from part (a) to predict the daily oil production in 2009. ANSWER 4760 gal for Examples 3, 4 and 5 GUIDED PRACTICE
OIL PRODUCTION: The table shows the U.S. daily oil production y(in thousands of barrels) xyears after 1994. 4. c. Use a graphing calculator to find and graph an equation of the best-fitting line. Repeat the prediction from part (b) using this equation. for Examples 3, 4 and 5 GUIDED PRACTICE
for Examples 3, 4 and 5 GUIDED PRACTICE ANSWER y = –130x + 6702 The daily oil production in 2009 will be 4752 gal.