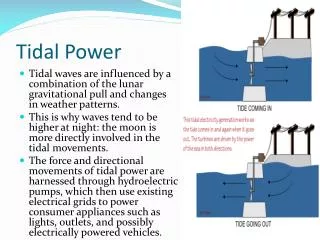
TIDAL DATUM COMPUTATION OVERVIEW
TIDAL DATUM COMPUTATION OVERVIEW. Tidal Datums. Definition NATIONAL TIDAL DATUM EPOCH (NTDE) Application Computation Geodetic Datums. VERTICAL DATUM :


TIDAL DATUM COMPUTATION OVERVIEW
E N D
Presentation Transcript
TIDAL DATUM COMPUTATION OVERVIEW
Tidal Datums • Definition • NATIONAL TIDAL DATUM EPOCH (NTDE) • Application • Computation • Geodetic Datums
VERTICALDATUM: • A base elevation used as a reference from which to reckon heights or depths. • TIDAL DATUM: • Defined by a certain phase of the tide (ex. MHW) • Are local datums • In order that they may be recovered and updated when needed, such datums are referred to fixed points on land known as Bench Marks
TIDAL DATUMS FROM TIME SERIES Higher High Higher High MHHW MHW High Observed Water Level Low MLW Lower Low Low MLLW Lower Low Day 1 Day 2 LMSL = avg. of hourly levels MTL = avg. of MHW and MLW DTL = avg. of MHHW and MLLW Water level record of 19 years (Tidal Epoch) 1983-2001
NATIONAL TIDAL DATUM EPOCH (NTDE) A common time period to which tidal datums are referenced • A specific 19 year period that includes the longest periodic tidal variations caused by the astronomic tide-producing forces. • Averages out long term seasonal meteorological, hydrologic, and oceanographic fluctuations. • Provides a nationally consistent tidal datum network (bench marks) by accounting for seasonal and apparent environmental trends in sea level that affects the accuracy of tidal datums. • The NWLON provides the data required to maintain the epoch and make primary and secondary determinations of tidal datums. • The present NTDE is 1983 through 2001.
Variations in Mean Range of tide due to the 18.6-year cycle of “Regression of the Moon’s Nodes” SEATTLE, PUGET SOUND, WA VARIATIONS IN MEAN RANGE OF TIDE: 1900 – 1996
1983-01 EPOCH ACTUAL IDEALIZED CHANGE OF TIDAL EPOCH
60-78 Epoch 83-01 Epoch MSL= 1.490 MSL= 1.542 MSL Linear Trend Epoch Change 0.051 m
Seldovia, Cook Inlet, AKTidal Datum Update Schematic Drop inWater Level
Galveston Pier 21, Galveston Channel, TX Rise inWater Level
General Requirements for Datum Determinationat a Short-Term Tide Station • Selection of an appropriate short-term station location and installation of sensors and bench marks. • Selection of an appropriate NOS primary or secondary control station. • Collection and processing of simultaneous data from control and short-term stations. • Obtain accepted datums from the control stations based on latest NTDE from NOS. • Computation of equivalent Epoch tidal datums using accepted procedures for simultaneous comparison. • Determine elevations of the tidal datums for each tidal bench mark.
TIDAL DATUMS Computation Primary Determination - The first reduction mean of all the tidal heights for a particular phase (HW or LW) of the tide over a specific 19-year period or National Tidal Datum Epoch to obtain Accepted Values for the station. Secondary or Tertiary Determination - The computation of equivalent 19-year mean values using a short series of observations using the method of comparison of simultaneous observations. Either monthly mean comparison or tide-by-tide comparisons are used. Standard Method - Values needed are MTL, Mn, DHQ, and DLQ as determined by comparison with an appropriate control (West Coast and Pacific Island, Mix Tide) MLW = MTL - 1/2 Mn MHW = MLW + Mn MLLW = MLW - DLQ MHHW = MHW + DHQ Modified Range Ratio Method - Values needed are MTL, DTL, Mn, and GT as determined by comparison with an appropriate control (East Coast, Gulf Coast and Caribbean Island, Semidiurnal and Diurnal) MLW = MTL - 1/2 Mn MHW = MLW + Mn MLLW = DTL - 1/2 Gt MHHW = MLLW + Gt
Types of Tide Semidiurnal Tide Mixed, mainly semidiurnal Mixed, mainly diurnal Diurnal
Tidal Datum Calculation Method of Comparison of Simultaneous Observations is a two-step process: 1. Compute the differences and/or ratios in the tidal parameters and differences in mean values between short-term and control stations over the period of simultaneous comparison. 2. Apply the differences and ratios computed above to the NTDE Accepted Values at the control station. This provides equivalent NTDE values for the short-term station.
STATION HIERARCHY • TERTIARY TIDE STATION: • more than 30 days but less than a year • PRIMARY TIDE STATION: • minimum of 19 years • allows statistical and datum control for short term stations • SECONDARY TIDE STATION: • minimum of 1 yr but less than 19 yrs
Monthly Mean Comparison using theModified-Range Ratio Method East Coast, Gulf Coast and Caribbean Island(Semidiurnal and Diurnal Tides)
Charleston Control Port Pulaski Subordinate
Simultaneous Comparison of MTL 1983-2001
Computation Flow of Monthly Mean Comparison Monthly Mean of each datum at Subordinate Monthly Mean of each datum at Control Average difference/Ratios between Monthly Mean of each datum between subordinate and control Use the average difference/ratios as corrector to adjust accepted 19-year datums at control station to derive 19-year datums at subordinate
Compute tidal datums at Fort Pulaski, Ga with Charleston, SC as a control by Monthly Mean Comparison usingModified-Range Ratio Method • MLW = MTL - (0.5 x Mn) • MHW = MLW + Mn • MLLW= DTL - (0.5 x Gt) • MHHW = MLLW + Gt • MTL, MN, DTL and GT have to be determined before computing MLW, MHW, MLLW, and MHHW
Tide-By-Tide (TBYT) Simultaneous Comparison TBYT Method -The TBYT Method is usually used when a full calendar month data are not available Pt.Chicago Bradmoor
Direct Method Simultaneous Comparison Direct Method -The Direct Method is usually used only when a full range of tidal values are not available. For example, direct MHW can be computed for situations when low waters are not recorded, such as in the upper reaches of a marsh. Since MTL, DTL, and Mn and Gt cannot be determined if low waters are cut-off, equivalent NTDE values for MHW and MHHW datums are determined directly by comparison of high tides with an appropriate control using the available part of the tidal cycle.
Tidal Datums and Methods Gulf Coast Examples
Datum Methods Gulf Coast Example 2 – Tide by Tide Comparison Panama City, FL – Subordinate Station • Make Observations • WL Data collected at 6-minute intervals, downloaded to • DMS, CORMS & Auto QC • Preliminary Analysis • Check station parameters, initialize data into working • table, fill gaps, QC • Tabulation • Tabulate Highs & Lows, QC & edit Hourly Heights & Hi/Lo • picks, Compute Monthly Means • *** This example - Data series too short to compute monthly means, or data starts & ends in middle of months • Compute Datums - Subordinate Station with <1 month of data • Make secondary determinations using simultaneous comparison of High & Low waters • Choose appropriate control station • Pensacola, FL • Choose appropriate method • (Gulf coast=Diurnal) • Modified-Range Ratio Method
Datum Methods Gulf Coast Example 1 – Comparison of Monthly Means Panama City, FL – Subordinate Station • Make Observations • WL Data collected at 6-minute intervals, downloaded to • DMS, CORMS & Auto QC • Preliminary Analysis • Check station parameters, initialize data into working • table, fill gaps, QC • Tabulation • Tabulate Highs & Lows, QC & edit Hourly Heights & Hi/Lo • picks, Compute Monthly Means • Compute Datums - Subordinate Station with <19ys of data • Make secondary determinations using simultaneous comparison of Monthly Means • Choose appropriate control station • Pensacola, FL • Choose appropriate method • (Gulf coast=Diurnal) • Modified-Range Ratio Method
Datum Methods Gulf Coast Example 1 – Comparison of Monthly Means Panama City, FL – Subordinate Station • Compare monthly means between Subordinate & Control to calculate correctedMTL, DTL, Mn, & GT for subordinate that will be used to calculate remaining datums (MLW, MHW, MLLW, MHHW, DHQ, DLQ) • Choose the time frame of data to use for comparison (in this example – 1 yr) • Get control station data from Tides & Currents website (Monthly means & Accepted datums) Monthly Means - control station (Pensacola) Monthly Means - uncorrected(Panama City)
Datum Methods Gulf Coast Example 1 – Comparison of Monthly Means Panama City, FL – Subordinate Station Apply corrected MTL, DTL, Mn, & GT to formulas for Modified-Range Ratio Method to calculate remaining NTDE equivalent datums for the subordinate Modified-Range Ratio Method Need corrected MTL, DTL, Mn, & GT from comparison to appropriate control station MLW = MTL - (0.5*Mn) MHHW = MLLW + GT MHW = MLW + MnDHQ = MHHW - MHW MLLW = DTL - (0.5*GT) DLQ = MLW - MLLW Panama City NTDE Equivalent datums MLW = 8.396 - (0.5*0.363) = 8.214MHHW = 8.188 + 0.419 = 8.607 MHW = 8.214 + 0.363 = 8.577DHQ = 8.607 - 8.577 = 0.03 MLLW = 8.397 - (0.5*0.419) = 8.188DLQ = 8.214 - 8.188 = 0.026
Datum Methods Gulf Coast Example 2 – Tide by Tide Comparison Panama City, FL – Subordinate Station • Compare highs & lows between Subordinate & Control to calculate corrected DTL, & GT for subordinate that will be used to calculate remaining datums (MLW, MHW, MLLW, MHHW, DHQ, DLQ) • Plot highs and lows to ensure that designations agree • If they do not, a type conversion is done for the subordinate • (ie. If sub. value is designated as LL, where control is L, then sub. is changed from LL to L so that the pair remains matched in designation)
ACCURACY OF TIDAL DATUM COMPUTATIONS DEPENDS UPON: • DATA QUALITY: MEASUREMENT SYSTEM ACCURACY, DATA CONTINUITY, QUALITY OF TABULATION OF THE TIDE, VERTICAL STABILITY OF THE STATION • SIMILARITY OF TIDAL CHARACTERISTICS: SIMILARITY IN TYPE OF TIDE, SIMILAR SHAPE OF THE TIDE CURVE (LITTLE SHALLOW WATER DISTORTION), SMALL DIFFERENCES IN TIME OF TIDE (HIGH AND LOW WATERS), SMALL DIFFERENCES IN MEAN RANGE OF TIDE AND IN THE DIURNAL INEQUALITIES • GEOGRAPHIC DISTANCE: DIFFERENTIAL EFFECTS OF THE WEATHER ON THE WATER LEVELS, DIFFERENCES IN SEA LEVEL TRENDS, DIFFERENTIAL EFFECTS OF SEICHE, EFFECTS OF RIVER FLOW
TIDAL DATUM ERROR (Swanson, 1974)
References http://tidesandcurrents.noaa.gov/pub.html
Geodetic Tie to Tidal Datums at NWLON Stations (GPS Example)
Published Benchmark Sheet http://tidesandcurrents.noaa.gov/station_retrieve.shtml?type=Bench+Mark+Data+Sheets