Download
1 / 14
140 likes | 148 Vues
This presentation explores the use of isotopes, specifically carbon-14, as tracers to track carbon fluxes in different processes. It discusses the production and distribution of carbon-14, the effects of human activities on carbon-14 levels, and the potential applications of carbon-14 measurements in understanding carbon-flux inversions. The presentation also acknowledges the contributions of various advisors, collaborators, and funding sources.

E N D
Assigning carbon fluxes to processes using measurements of the isotopic abundance of carbon-14 Nir Y Krakauer Department of Earth and Planetary Science University of California at Berkeley niryk@berkeley.edu
Isotopes as process tracers CO2 13C ∆14C
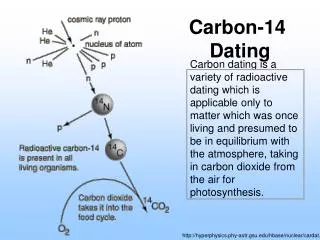
14C (radiocarbon) in the Holocene • 14C (λ1/2 = 5730 years) is produced in the upper atmosphere at ~6 kg / year • Notation: Δ14C = 14C/12C ratio relative to the preindustrial troposphere (19th century tree rings) • Tropospheric Δ14C was lowest in the south, where exchange with deep ocean water is most intense Stratosphere+80‰ 90 Pg C 14N(n,p)14C Troposphere0‰ 500 Pg C Land biota–3‰ 1500 Pg C Air-sea gas exchange Shallow ocean –50‰ 600 Pg C Deep ocean–170‰ 37000 Pg C Sediments–1000‰ 1000000 Pg C
The bomb spike: atmosphere and surface ocean Δ14C since 1950 • Massive production in nuclear tests ca. 1960 (“bomb 14C”) • Through air-sea gas exchange, the ocean took up ~half of the bomb 14C by the 1980s data: Levin & Kromer 2004; Manning et al 1990; Druffel 1987; Druffel 1989; Druffel & Griffin 1995 bomb spike
The contemporary budget for atmospheric Δ14C Contribution (‰/yr) Biosphere +4 Fossil fuels −10 Cosmogenic +6 Ocean −6 Total −6 Cf. Krakauer et al 2006
Modeled gradients in atmospheric Δ14C Fossil-fuel burning Forest release Ocean uptake (‰)
Growing-season Δ14C over the USA Hsueh et al., Regional patterns of radiocarbon and fossil fuel-derived CO2 in surface air across North America, GRL (2007)
1) Transport model testing: what’s the N-S gradient due to fossil-fuel burning? • “The ratio of largest fossil fuel interhemispheric difference to smallest IHD is 1.5 compared to 2.0 for the fossil simulation results from TransCom 1” (Gurney et al 2003) • Ongoing analysis of Scripps air archive (Heather Graven) • Combine with earlier measurements to fix fossil vs. ocean contributions Levin and Hesshaimer 2000
2) Vertical dispersion of fossil fuel CO2 • Comparison of actual with modeled vertical CO2 profiles suggests that most TransCom 3 models keep too much fossil-fuel CO2 near the surface, creating a bias in flux estimation from predominantly surface data (Yang et al, New constraints on Northern Hemisphere growing season net flux, submitted to GRL) • Vertical profiles of Δ14C enable distinguishing biotic from fossil CO2 fluxes Turnbull et al 2006
3) Verification of fossil-fuel burning figures • Given transport errors, regional fossil-fuel burning can be estimated from Δ14C measurements only to within ~20%; is this ever useful? • Time series of Δ14C depletion can reveal trends in fossil fuel use more accurately, though, with accuracy of up to perhaps ~5% Levin et al 2003
Acknowledgements • Advisors and collaborators: Inez Fung, Jim Randerson, Tapio Schneider • Δ14C measurements and interpretation: Stanley Tyler, Sue Trumbore, Xiaomei Xu, John Southon, Jess Adkins, Paul Wennberg, Yuk Yung, Heather Graven, François Primeau, Dimitris Menemenlis, Nicolas Gruber • NOAA, NASA, and the Betty and Gordon Moore Foundation for fellowships