Download

1 / 59
600 likes | 754 Vues
NATIONAL CENTER FOR HEALTH STATISTICS 2012 DATA CONFERENCE Self Harm in the United states: What We can Learn from National AND State-Level medical Datasets . T. Michael Kashner , jd , phd

E N D
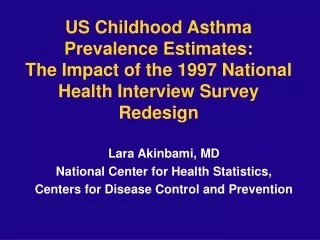
NATIONAL CENTER FOR HEALTH STATISTICS • 2012 DATA CONFERENCESelf Harm in the United states: What We can Learn from National AND State-Level medical Datasets T. Michael Kashner, jd, phd Center of Excellence for education & Advanced Biostatistics & Office of education Veterans administration, Washington, dc Cindy Claassen, PhD University of north texas health science center &john peter smith healthcare system Fort worth, texas
Acknowledgements • Jessica Ingram, MA Data Specialist, UNT Health Sciences Center • des AngesCruser, PhD, Director of Mental Sciences Institute, UNTHSC • Alan Podawiltz, MD, Chairman of Psychiatry, UNT HSC • Iris Shimizu, PhD, National Center for Health Statistics • Claudia Steiner, MD, Healthcare Cost & Utilization Project Funded by a grant from the American Foundation for Suicide Prevention State HCUP datasets used in these analyses: Arizona, California, Utah, Nebraska and Florida; State Emergency Department Databases (SEDDs) & State Inpatient Databases (SIDs); Healthcare Cost and Utilization Project (HCUP) Agency for Healthcare Research and Quality.
Why Surveillance of Self Harm? “To address suicide as a public health problem requires the sustained and systematic collection, analysis and dissemination of accurate information on the incidence, prevalence and characteristics of suicide and suicide attempts. Surveillance is a cornerstone of public health, allowing realistic priority setting, the design of effective prevention initiatives, and the ability to evaluate such programs.” --Institute of Medicine (IOM), 2002 • Self harm is a risk factor for suicide and suicide is a rare event. Accurate characterization of infrequent and rare events requires data collection among very large, representative groups. • Nonfatal self harm in and of itself is an important public health concern. (IOM) Goldsmith, S, Pellmar, T, Kleinman, A and Bunney, W, eds., Reducing Suicide: A National Imperative, ed. Institute of Medicine Committee on Pathophysiology and Prevention of Adolescent and Adult Suicide. 2002, Washington, DC: National Academy Press.
The Study of Nonfatal Self Harm in the United States May or may not display the same patterns as self harm in Europe and Asia; systematic US investigations only recently begun. • Three primary types of self harm information available in the US: • Self-report data collected via household interviews • Medical encounter data • collected via hospital-based sampling • collected via secondary analysis of comprehensive state, local or provider-based administrative & claims datasets • Case histories often collected via mixed methods that involve collection of both interview and medical data, as well as data from other sources.
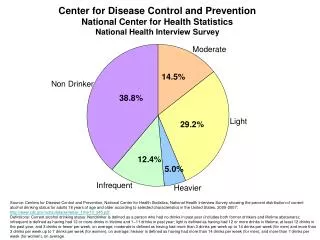
Nationally Representative Emergency Department Samples The National Center for Health Statistics National Hospital Ambulatory Care Survey – Emergency Department database (NHAMCS-ED) CDC’s National Center for Injury Control & Prevention National Electronic Injury Surveillance System—All Injury Program (NEISS-AIP) Agency for Healthcare Research and Quality Healthcare Cost and Utilization Project’s (HCUP’s) Nationwide Emergency Department Sample (NEDS) and National Inpatient Sample (NIS)
Sources of Data • NEDS, NHAMCS-ED and NEISS-AIP all capture visit-level information. • NHAMCS data are derived from a sample of medical records during a randomly-assigned 4-week period of time • NEISS-AIP is a specialty data source focused on detailed information about nonfatal, first-time injuries as reported in a sample of medical records. • NEDS data are taken from a sample of the universe of billing records in a year Owens, P, Barrett, M, Gibson, T, et al., Emergency department care in the United States: A profile of national data sources. Annals of Emergency Medicine, 2010. 56: p. 150-156s.
Comparison of National Estimates of Self Harm Visits from NEDS, NHAMCS-ED and NEISS-AIPz Owens, P, Barrett, M, Gibson, T, et al., Emergency department care in the United States: A profile of national data sources. Annals of Emergency Medicine, 2010. 56: p. 150-156s.
Comparison of Variables Owens, P, Barrett, M, Gibson, T, et al., Emergency department care in the United States: A profile of national data sources. Annals of Emergency Medicine, 2010. 56: p. 150-156s.
Conclusions from Owens, et al. • There is no one definitive source for ED-based analyses. • “Moreover, differences in estimates across these data sources are likely related to differences in target population, sampling design, operational definitions of constructs, and variation in reporting/ recording.” • “Quality of care for relatively rare events or related conditions might best be conducted with the NEDS, given its large sample size and greater number of diagnoses and E codes relative to NHAMCS.” Owens, P, Barrett, M, Gibson, T, et al., Emergency department care in the United States: A profile of national data sources. Annals of Emergency Medicine, 2010. 56: p. 150-156s.
Some of the Questions Current Sampling Approaches Cannot Answer • At present, no national sampling strategy is constructed to follow patients longitudinally, so medically-treated, repetitive self harm behavior cannot be characterized in these data. • It is difficult to appreciate the apparent unevenness of the geographic distribution of nonfatal suicidal behavior in the US in these datasets, and analyses of why this is true are not possible in these data. Contribution of Nonfatal ED-treated, Nonfatal Hospitalized and Fatal Intentional Self-Harm Events to Overall Event Rates by State, 2001:Crude Rates per 100,000 Claassen, C and Trivedi, M, Datapoints: Rates of nonfatal intentional self-harm in nine states, 2001. PsychiatrServ, 2006. 57(3): p. 313.
“Boundaried” High-Risk Populations • Goal: • To locate settings • with concentrations of individuals at high risk for self harm • who are accessible for suicide prevention (risk-lowering) interventions.
State Claims Datasets: DEMONSTRATION EXERCISE: TOPOGRAPHY OF self harm in five states
Another Alternative State-Level Administrative Claims Data States with Centralized Collection Processes for Inpatient (Hospital Discharge) Data Classified by E-Code Collection Status, 2007 • A number of US states now have systems in place to collect data on all inpatient, ambulatory care and ED treated-and-released medical encounters occurring within the state annually. Therefore, for those states,information on the universe of medically-treated self harm acts is now available. • A portion of these state datasets containE-code diagnoses and a patient-level encrypted identifier,permitting both identification of self-inflicted injury episodes and patient-level linkage across visits. States with Centralized Collection Processes for Emergency Department (Discharge) Data Classified by E-Code Collection Status, 2007
Demonstration exercise CASE STATE selection & case identification • CASE STATES: • Mandatory (legislated) reporting of inpatient and ED encounters • Mandatory E-coding of all injury events included with reporting • States ≥ 3 years data collection prior to study time frame • AHRQ quality check indicating E-Code completeness of > 85% on BOTH inpatient and ED datasets, using the STIPDA-defined injury ICD codes • Participation in the Agency for Healthcare Research and Quality’s Healthcare Cost and Utilization Project (HCUP) Revisit Analysis program • CASEs: • Any encounter with self harm E-Code
California Arizona • Utah • Nebraska • Florida • South Carolina States Used in 2006-2007 Self Harm Analyses • Maine • New York • Nebraska • Utah California Arizona • South Carolina • Florida • New York • Maine
Data Quality Issues in Administrative Claims Data Used for Self Harm Surveillance • PRESENCE/ABSENCE OF ESSENTIAL SURVEILLANCE DATA ELEMENTS • Maturity of Data Collection System • overall HOSPITAL REPORTING CONSISTENCY • NUMBER OF E-CODE FIELDS ON CLAIMS FORM (VARIES BY STATE) • E-CODE FIDELITY: • % INJURY EPISODES IN DATASET • % MISSING ECODES • % THREE DIGIT ONLY E-CODES • % INVALID E-CODES • Completeness of RECORD LINKAGE • Other INCONSISTENT /MISSING DATA
ESSENTIAL SURVEILLANCE DATA ELEMENTS (Hawton, 2006) • Gender • Date of Birth • Geographic Indicator • Marital Status • Race/Ethnicity • Date of self-inflicted injury • Date of presentation for care • Time of presentation for care • ED discharge status • Psychosocial assessment conducted (Yes, No) • Method of self-injury
Technical Analysis of Data Quality • Maturity of Data Collection System: • All states > 2 prior years data collection before study time frame. • OVERALL REPORTING CONSISTENCY BY HOSPITAL: • (Completed for three states with both hospital ID and month of visit variables for hospitals with > 20 self harm visits per month.) • Three California hospitals had missing data for at least one complete month. • E-CODE FIDELITY: % INJURY EPISODES IN DATASET) • Percent injury visits in dataset: 22.3% vs. • NEDS, 2005: 23.8%; NHAMCS-ED, 2005: 25.4%
Technical Analysis of Data Quality % missing E-CODE (COMPLETENESS): • Completeness: 91.7% • Sensitivity: 0.92 • Specificity: 0.96 • Positive Predictive Value: 0.84 • Negative Predictive Value: 0.098
Technical Analysis of Data Quality Completeness of RECORD LINKAGE (SELF HARM VISITS)
Summary: Data Quality in the Administrative Dataset Used for Recurrent Self Harm Analysis • Summary: • Missing date of injury, hour of admission, marital status & reliable indicator of psychosocial intervention for ED pts. • Data collection mature and assumed reliable for 661 of 664 hospitals with at least one suicide attempt reported in two-year period. • Three-six E-Code fields available, with only < 5 in Florida only. • % injuries in data set is consistent with national norms; % missing E-Codes/3-digit E-Codes/Invalid E-Codes is negligible • Record linkage a problem for CA data (19.1% missing PIDs) and FL data (8.4% missing PIDs). • Other inconsistencies negligible. • PRESENCE/ABSENCE OF ESSENTIAL SURVEILLANCE DATA ELEMENTS • Maturity of Data Collection System • overall HOSPITAL REPORTING CONSISTENCY • NUMBER OF E-CODE FIELDS ON CLAIMS FORM (VARIES BY STATE) • E-CODE FIDELITY: • % INJURY EPISODES IN DATASET • % MISSING ECODES • % THREE DIGIT ONLY E-CODES • % INVALID E-CODES • Completeness of RECORD LINKAGE • Other INCONSISTENT /MISSING DATA
Operationalized Definitions (Intentional) Self Harm: ICD-9 E-coded event designating new episode of intentional self harm (E950-E958) occurring in an E-Code field in the dataset for either ED-treated or inpatient episodes of care. • Occurring to an individual 10 years of age or older • Treated in one of the hospitals included in the 5-state HCUP dataset. • Note that E959 (late effects) not used because this code does not necessarily designate a new event. Self Harm ‘Event:’ Database observation representing a care for self harm occurring in a single setting at a single point in time. Self Harm ‘Episode of Care:’ All dataset observations that represent care for the same self harm event – an episode may encompass one or more ‘events,’ depending on whether the pt was treated in the ED, on an Inpatient Service, or one or more of both types of settings.
self-harming patients and treatment State-level Event & Person Comparisons * U.S Average Crude Suicide rate per 100,000, 2006-2007 = 11.31
self-harming patients and treatment State-level Event & Person Comparisons * Definition, per 2003 Urban Influence Codes: Non-metro, noncore, adjacent / not adjacent to small metro ** Overall Event-level % lowest SES quartile by state in dbase: 30.1% lowest quartile; 56.6% lowest half
self-harming patients and treatment State-level Event & Person Comparisons Percent of Total
self-harming patients and treatment State-level Event & Person Comparisons
self-harming patients and treatment Description of Recurrent Self Harm
self-harming patients and treatment Description of Recurrent Self Harm
self-harming patients and treatment 2. % Methods by Event Count
self-harming patients and treatment 2. Hospitalization Rates by Event Number Event 1 Event 2 Event 3 Event 4 Event 5 Event 6 Event 7 Event 8 Event 9 Event 10 Event 11 Event 12
self-harming patients and treatment 2. Time to Second Nonfatal Event
How Representative are the Data? * Eliminates E-code 959.0 – Late effects, in order to compare to NEISS-AIP • Sources Centers for Disease Control and Prevention, National Center for Injury Prevention and Control. Web-Based Injury Statistics Query and Reporting System (WISQARS) Available online at: http://www.cdc.gov/injury/wisqars/nonfatal.html
self-harming patients and treatment Conclusions The informed use of event-based medical data may well represent the most powerful approach currently available for answering a host of previously unanswerable epidemiological questions about intentional self-injury in the United States, such as: • In what communities are rates of self harm behavior rising or declining among the very young or other demographic groups? • How do large, community-based training initiatives such as Gatekeeper Training impact rates of presentation for care among high risk groups? • Does post-injury medical care impact the risk of near-term repetition? • What specific provider/healthcare system factors are associated with lower or higher rates of near-term self harm?
“Trading Up” in Mechanism across Repetitions: Between Method Trade-Ups Within Method Trade-Ups Poisoning Firearms Poisoning Drowning / Hanging Cutting Cutting / Poisoning Cutting
2. Average Time Between Nonfatal Events: All Methods self-harming patients with multiple self-injury events
2. Who “Trades Up” in Method of Injury across Repetitions: self-harming patients with multiple self-injury events Logistic Regression Results Test of Model Coefficients : x2 (15) = 1451.02, p < 0.0005 Hosmer & Lemeshow Goodness of Fit: x2(8)= 8.63, p = 0.37
Comparison of Variables Owens, P, Barrett, M, Gibson, T, et al., Emergency department care in the United States: A profile of national data sources. Annals of Emergency Medicine, 2010. 56: p. 150-156s.
NHAMCS-ED • Started in 1992; a stratified, representative sampling of visits to US emergency departments weighted to generate annual national and regional estimates. • Sampling Frame: generally includes 400-500+ hospitals / yr • Hospitals are divided into 16 data collection subsets of 37-41 hospitals each, and data is collected from a random sample of 100 patient visits during a randomly assigned 4-week period. • The entire cohort of hospitals therefore assumes this role on a rotating basis, with each hospital collected one month’s worth of data approximately every 15 months. • Small number of “raw” self harm visits in annual datasets sometimes weighted very heavily. • For these reasons, NHAMCS data are never used to characterize self harm behavior below the regional level, and multiple years of data should be used to establish rates. • Case definition of self harm event is via diagnostic E-Code and medical record review.
NEISS-AIP • Operated jointly by the CDC’s National Center for Injury Prevention and Control and the US Consumer Product Safety Commission. • Data collection is done continuously in 66 hospitals, stratified in 5 levels by hospital size based on annual ED visits, plus one stratum for children’s hospitals. • NEISS-AIP can be used in national, regional or state-level surveillance activities. • Suicidal intent is confirmed during structured review of data extraction forms based on explicit criteria
HCUP’S NEDS • Started in 2006, annual datasets contain over 25 million unweighted ED medical records from over 950 hospitals for each year of data collection and approximates a 20-percent stratified sample of U.S. hospital-based EDs. • Derived from state-level administrative claims datasets which comprise the universe of ED medical encounters occurring within 24-29 states. • If an ED is selected for the NEDS sample, then all of the ED admissions for that year are included in the NEDS. • Stratification protocol considers the following hospital characteristics: geographic region, teaching status, control, urban-rural location and trauma center designation. • Does not include state identifiers, so can be used in national studies but not state- or local analyses or in analyses that require patient-level tracking across time. • Case definition of self harm event is user-defined, based on available data – E-Codes.
Data Quality Issues in Administrative Claims Data Used for Self Harm Surveillance • PRESENCE/ABSENCE OF ESSENTIAL SURVEILLANCE DATA ELEMENTS • Maturity of Data Collection System • overall HOSPITAL REPORTING CONSISTENCY • NUMBER OF E-CODE FIELDS ON CLAIMS FORM (VARIES BY STATE) • E-CODE FIDELITY: • % INJURY EPISODES IN DATASET • % MISSING ECODES • % THREE DIGIT ONLY E-CODES • % INVALID E-CODES • Completeness of RECORD LINKAGE • Other INCONSISTENT /MISSING DATA