Download
1 / 17
170 likes | 292 Vues
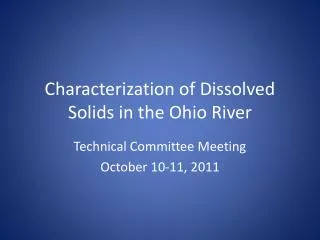
Characterization of Dissolved Solids in the Ohio River. Technical Committee meeting February 12-13, 2013. Study Objectives. Characterize ambient background levels of TDS Develop site-specific translators to convert conductivity to TDS

E N D
Characterization of Dissolved Solids in the Ohio River Technical Committee meeting February 12-13, 2013
Study Objectives • Characterize ambient background levels of TDS • Develop site-specific translators to convert conductivity to TDS • Quantify TDS constituent makeup to evaluate seasonal and spatial variability • Provide data to support possible development of an Ohio River bromide stream criterion
Sampling Design • Weekly samples collected at 16 sites • Collection sites located at water intakes • Participants identified through the WUAC and PIAC • Sampling conducted for 1-year • December, 2011 thru December 2012 • Analysis – In-house and contract lab
Analysis • pH • Conductivity • Temperature • Stream flow • Coordinate THM sampling when possible Dissolved Solids Analytes Supplemental Parameters • Chloride • Sulfate • Bromide • Fluoride • Bicarbonate • Total Dissolved Solids Sodium Potassium Magnesium Calcium Lithium
TDS Results Summary • Ohio River • Ranged from 104 to 368 mg/L • Median conc ~190 to 230 mg/L • Tributaries • Ranged from 62 to 584 mg/L • Median conc ~160 to 360 mg/L
TDS by LocationAll Sites TDS Standard = 500 mg/L
TDS by Date TDS Standard = 500 mg/L
Bromide Results Summary • Ohio River • Ranged from <0.035 to 1.17 mg/L • Median conc 0.076 to 0.125 mg/L • Tributaries • Ranged from <0.035 to 1.12 mg/L • Median conc 0.036 to 0.105 mg/L
Data Assessment • Data assessment ongoing • Compare TDS results to 500 mg/L standard • Levels did not approach standard on the Ohio River • 6 samples from Muskingum and Big Sandy >500 mg/L • Evaluate spatial and seasonal trends • Concentrations are inversely correlated with stream flow • Tributaries exhibited higher and more variable levels of TDS; lower and less variable bromide levels • Develop site specific relationship between TDS and conductivity • Not yet assessed • Evaluate relationship between bromide in source water and THMs in finished water • Not yet assessed; Compiling THM data from water utilities • Report to be completed mid 2013.