Design of UAV Systems
650 likes | 978 Vues
Design of UAV Systems. Putting it all together. Objectives. Lesson objective - to show how to Put it all together With a focus on … The air vehicle. Expectations - You will better understand how to approach air vehicle design. 2002 LM Corporation. 24-1. Design of UAV Systems.

Design of UAV Systems
E N D
Presentation Transcript
Design of UAV Systems Putting it all together Objectives • Lesson objective - to show how to • Put it all together • With a focus on … • The air vehicle Expectations - You will better understand how to approach air vehicle design 2002 LM Corporation 24-1
Design of UAV Systems Putting it all together 2002 LM Corporation How do we start - review • Analyze the problem • What does the air vehicle have to do? • Is any information missing? • Look at some potential solutions • What are the overall design drivers? • Payload weight and volume • Range and endurance • Speed and propulsion type • Pick a starting baseline • Analyze starting baseline • Size and weight; range and endurance • Analyze the other approaches • Compare results and select preferred baseline • Define preferred overall system • Reasonable balance of cost, risk and effectiveness • Document results Today 24-2
Design of UAV Systems Putting it all together 2002 LM Corporation What kind of air vehicle - review • Operates from 3000 ft paved runway (defined reqmn’t) • Loiters over an area of interest (defined reqmn’t) • At h = 10-17Kft, 158nm-255 nm from base (derived) • Baseline loiter time = 12 hrs, do trade study on 6 and12 hr (system engineer, team decision) • Fly circular pattern, 2 minute turns (derived) • Maximum coverage area = 200nm x 200 nm (defined) • WAS for 10 sqm moving targets in 2 minutes (defined) • Dashes 141 nm to target in 30 min. (derived reqm’nt) • Once per hour (follow-up customer response) • Based on WAS sensor or other information • Images targets from 10 Kft (derived reqm’nt) • Operates in “all weather” • - 60% good weather, 30% bad but flyable, 10% terrible weather (unflyable) • This conflicts with our 100% availability assumption 24-3
Design of UAV Systems Putting it all together 2002 LM Corporation Our first decision- review • It is a very important one • What is the best propulsion cycle for the mission? • Internal combustion (IC), turboprop (TBProp) and turbo fan (TBFan) engines can all meet baseline speed (280 kt) and altitude (10-17Kft) requirements • We bring our team together for the decision • Speed and altitude is at the upper end of IC capability, reliability required will be a challenge for an IC engine • TBProp is good cycle for low-medium altitude operations • TBFan is best at altitudes > 36 Kft but has best reliability • We select the TBProp as our starting baseline and agree to evaluate a TBFan as the primary alternative • IC alternative decision will be based on size required • Conventional wing-body-tail configuration(s) selected • Evaluate innovative concepts during conceptual design • We document our decisions as “derived requirements” 24-4
Design of UAV Systems Putting it all together 2002 LM Corporation Next decision- review • How many engines? • Generally determined by available engine size • The smallest number of engines will always be the lightest and lowest drag • How big will they be? • Engine size is determined by thrust or horsepower-to-weight required to meet performance requirements • One sizing consideration is takeoff; others are speed, acceleration and maneuver • Initially we size for takeoff • We design for balanced field length (BFL) = 3000 ft • Approximate BFL = 1500 ft ground roll to lift off speed, 1500 ft to stop if engine fails at liftoff • Later we will calculate performance over the entire mission and ensure that all requirements can be met • This is what we will do today 24-5
Design of UAV Systems Putting it all together 2002 LM Corporation Review – reqmn’t disconnect • Initial system assessment assumed 100% air vehicle availability, weather now limits availability to 90% • This will affect SAR sizing (primarily) • We assumed SAR operation 100% of the time, therefore, the SAR only needed 80% area coverage • At 90% availability, the SAR needs to provide 89% area coverage (range increase to 102km) to achieve overall 80% (threshold) target coverage • We decided to leave the baseline alone and finish the first design cycle before making the change? • During any design cycle, there will always be design and requirement disconnects • If we change baseline every time we find a disconnect, we would never complete even one analysis cycle • Orderly changes occur at the end of an analysis cycle 24-6
Design of UAV Systems Putting it all together 2002 LM Corporation Review - fuselage considerations • Our methodology sizes the fuselage as a cylindrical center section with elliptical fore and aft bodies • The fuselage is defined in absolute and relative terms • Fuselage equivalent diameter (Df-eq) is absolute but is iterated to assure volume required = available • Relative variables are length to equivalent diameter ratio (Lf/Df-eq), and forebody and aftbody length ratios • At a maximum speed of 282kts, a relatively low fineness ratio (Lf/Df-eq) can be used with minimum drag impact • We select a nominal value of 7.0 (cigar shape) to minimize wetted area (a weight and drag driver) • If we assume the fuselage forebody length = 1Df-eq and the aftbody = 2Df-eq, center section length (Lc) ratio will be 4/7 or Lc/Lf = 0.571 24-7
Design of UAV Systems Putting it all together 2002 LM Corporation Review - fuselage volume • To get started we put payload in the fuselage center section, close to the vehicle center of gravity • It accommodates a payload weight of 720 lbm and a volume of 26.55 cuft (density = 27.1 pcf) • It also carries some fuel (amount TBD, density = 50 pcf at “packing factor” PF = 0.8 or installed density = 40 pcf) • And it carries airframe structure and some systems (landing gear, etc., nominal installed density = 25 pcf*) • We assume other systems are in the fore & aftbodies • We assume center section volume (Vc) is allocated entirely to payload at a packing factor (PF) = 0.7 • Therefore, Vc required = 26.55/0.7 = 37.9 cuft • Later the spreadsheet will size for actual volume required * 25 pcf is a reasonable estimate for installed electrical, mechanical systems including avionics, landing gear and engines 24-8
Design of UAV Systems • From simple geometry, we express fuselage center section volume in terms of fuselage center section equivalent diameter (De) and Length (Lc) or • Vc = (/4)LcDe^2 = (/4)(Lc/Lf)(Lf/Df)De^3 • Vc = 37.9, Lc/Lf = 0.571 and Lf/De = 7 • De = 2.29 ft, Lf = 16 ft and Lc = 9.16 ft • Assuming forebody length = De and aftbody length = 2*De (k1 = 0.143, k2 = 0.286), L/D = 7 and w/h = 1 • Fuselage wetted area (SwetF) would be = 106.3 sqft • Knowing wetted area, we could calculate a fuselage drag coefficient = SwetFCfe/Sref (RayAD 12.5) and fuselage weight Wfuse) = SwetF*UWF • However, we will let the spreadsheet model do this for us later as part of an integrated analysis where or Putting it all together 2002 LM Corporation Review - fuselage geometry 24-9
Design of UAV Systems Putting it all together 2002 LM Corporation Review - engine installation • Simple engine installations are always best unless there are over-riding considerations • Such as high speed, stealth, thrust vectoring, etc. • Otherwise, complexity reduces overall performance • Nacelle geometry is driven by engine installation • TBProp nacelles should be low drag, minimum length • Our methodology models nacelles like mini-fuselages • Cylindrical center section, elliptical fore and aft bodies • Nacelle type is defined by an input wetted area fraction (vs. a typical podded nacelle) • 1.0 = typical podded commercial jet transport nacelle • 0.5 = nacelle attached to fuselage (e.g. Global Hawk) • 0.0 = engine buried in the fuselage (e.g. DarkStar) • We assume a single, attached, aft mounted engine • L/Dnac = 4; k1 = 0.2; k2 = 0.4; Dnac/Deng = 1.25; nacelle Swet fraction = 0.5 Change from lesson 20 24-10
Design of UAV Systems Putting it all together 2002 LM Corporation Wing considerations (expanded) • Our design methodology sizes the wing separate from the fuselage • We have 4 primary decisions to make: size (planform area or Sref), shape (Aspect ratio or AR and taper ratio or ), sweep () and thickness ratio (t/c) • Planform area will be determined by wing loading (W0/Sref), a primary design variable • A reasonable value for a turboprop is 30-60 psf (PredatorB & RayAD Table 5.5) • We pick a value of 30 and later will refine the estimate to ensure takeoff/cruise/loiter requirements are met • AR is a primary wing design variable determined by speed, maneuverability and lift-to-drag (L/D or LoD) ratio • High AR generally means high LoD (>20), low maneuverability (a few g’s) and low speed (<350 kts) • For long endurance we select a starting value of 20 24-11
Design of UAV Systems Putting it all together 2002 LM Corporation Wing - continued • Taper ratio () is a secondary wing design variable that drives wing drag due to lift achieved vs. a theoretical minimum (see RayAD Fig. 4-23) • A nominal value is 0.5 selected and needs no further pre-concept design trade • Wing sweep is driven by speed, at a maximum speed of 282 kts we have no need for wing sweep • Wing t/c has a major impact on wing weight, the higher the t/c, the lighter the wing weight • High t/c increases drag but trades favorably against wing weight at low speed • At 282 kts we select a nominal maximum value (t/c = 0.13), it needs no further pre-concept design trades • Of the wing design variables selected, only W0/Sref and AR need to be traded for our speed range 24-12
Design of UAV Systems Putting it all together 2002 LM Corporation Review - wing volume • Another concept design wing consideration is volume available for fuel • Wing fuel volume is defined in terms of percent wing chord and span available for tankage • Typically wing tanks start at the wing root or fuselage attachment and can extend to or near the wing tip • For our UAV application we assume the wing tank starts at 10% span and extends to 90% span (1 = 0.1, 2 = 0.9). We estimate tank chord at 50% wing chord (Kc = 0.5)and fuel packing factor at 0.8 • These initial estimates are not upper limit values • The tanks could extend from fuselage centerline to wing tip if required (1 = 0, 2 = 1) but it is unlikely that tank chord will exceed the assumed 50% • Fuel density again is estimated at 50 pcf at PF = 0.8 Another change 24-13
Design of UAV Systems Putting it all together 2002 LM Corporation Tail considerations • During pre-concept design, our primary concern is tail type and size • We use parametric (historical) data to estimate both horizontal and vertical tail size required • For “V-tails” we size using projected areas • During conceptual design we will resize to ensure adequate stability and control and handling qualities • Our geometry model defines horizontal tail area (Sht) and vertical tail area (Svt) as fractions of Sref or… • Sht = KhtSref and Svt = KvtSref • Where for an average air vehicle • Kht ≈ .25 and Kvt ≈ .15 • “Average” V-tail area would be 0.39Sref • Our UAV will use an average V-tail area fraction Another change 24-14
Design of UAV Systems Putting it all together 2002 LM Corporation Review - aerodynamic model • Our aerodynamic model estimates lift and drag from geometry and input values of equivalent skin friction coefficient (Cfe) and “Oswald” wing efficiency (e) • We will assume a state-of-the art Cfe value of 0.0035 to reflect our assumption of good surface smoothness (See RayAD Table 12.3) • Wing efficiency (e) is estimated at a value of 0.8 using parametric data for an unswept wing at AR = 20 • The model uses these inputs to calculate minimum and induced drag coefficients (Cd0 and Cdi) • Lift coefficients are calculated from weight (W), Sref and flight dynamic pressure (q) where • Cl = W/(qSref) • Loiter and climb q are assumed to be at max L/D 24-15
Design of UAV Systems Putting it all together 2002 LM Corporation Review - weight model • “Bottoms-up” weight estimates are based on a combination of methods • Airframe weight estimates use input unit weights and calculated wetted or planform areas • Propulsion weight is based on T0/Weng or Bhp0/Weng • Landing gear weight (Wlg) is based on an input gross weight (W0) fraction where Wlg = KwlgW0 • “Other system” weights (Wsys) use another input weight fraction where Wsys = KsysW0 • We will use nominal values from RayAD Table 15.2 adjusted for a typical turboprop UAV where • Wing unit weight (Uww) = 3.25 psf • Tail unit weight (Utw) = 2.6 psf • Fuselage/nacelle unit weight (Ufpnw)= 1.8 psf • Klg = 0.05 and Ksys (or “all-else empty” ) = 0.12 • We also include an empty weight margin (5%) Another change 24-16
Design of UAV Systems Putting it all together 2002 LM Corporation Review - volume model • Volume requirements are calculated while iterating bottoms-up weight and geometry • Fuel, payload, system and landing gear weights are used to estimate fuselage and pod (if any) volume required • Fuel volume = fuel weight/( fuel densityPF ) • Payload volume = 26.55 cuft (chart 11-61) • Landing gear volume = gear weight/25 pcf • Other systems volume = other systems weight/25 pcf • Volume available is calculated by the geometry model using input estimates of useable volume per component • Nominal value = 0.7 for fuselage and pods (if any) • Nominal value for nacelles is a configuration variable • In our baseline, we assume the nacelle is unavailable for anything except the engine, inlet and nozzle • Df-eq is adjusted to equate volume available and volume required plus 30% margin (or PF = 0.7/1.3 = 0.54) Final change 24-17
Design of UAV Systems Putting it all together 2002 LM Corporation Review - propulsion model • Our propulsion model is a simplified “cycle deck” used to represent both turboprops (TBP) and turbofans (TBF) • Engines are sized at sea level static conditions (h=0, V=0) based on input values of thrust or power to gross weight required (T0/W0 or Bhp0/W0) • The models predict performance at other values of altitude and speed by assuming that power or thrust vary primarily with airflow (WdotA) • Differences between TBFs and TBPs are determined by input values of bypass ratio (BPR), fan specific thrust (T0-fan/W0dotA-fan) and a reference speed (V0) • Our UAV studies will use the TBP and TBF values in Lesson 18, chart 18.33 24-18
Design of UAV Systems Putting it all together 2002 LM Corporation Review - air vehicle performance • Air vehicle performance is estimated using calculated values of gross weight (W0), empty weight (We or EW) and fuel weight (Wf) • The mission is calculated forward and backward • Forward calculations use simplified performance models to estimate fuel required for engine start-taxi-takeoff, climb and cruise out to initial loiter location • Another calculation works backward from empty weight and calculates fuel required for landing reserves and loiter, cruise back, dash from target, combat over the target (including payload drop) and dash to target • The sum of the two subtracted from the starting fuel weight is the amount of fuel available for loiter • A Breguet endurance calculation using the pre and post loiter weights then predicts operational endurance 24-19
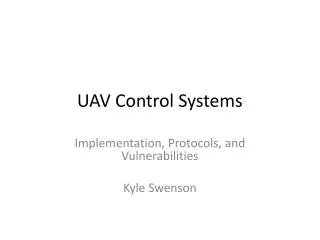
Design of UAV Systems 255 nm 158 nm 100 nm 200 nm x 200 nm Putting it all together 2002 LM Corporation Review - mission description • We will define our mission to meet maximum distance requirements for each of the two mission types • WAS cruise out = 255nm at 27.4Kft • Baseline operational endurance is 12 hr, with trade study options for 6 hr and 24 hr endurance • Positive ID mission cruise out = 200 nm @ TBD Kft • We will size for 12 hrs over the surveillance area, including loiter and ingress/egress • The positive ID mission requires a • 282 kt dash (out and back) • Based on requirement for • 1 target ID per hour • 3000ft balanced field length • takeoff and landing requirements • are assumed • - Clto = 1.49, Bhp0/W0 = 0.092 24-20
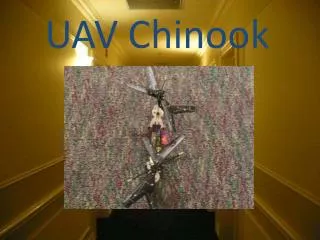
Design of UAV Systems 12 13 14 17 16 15 4 9 5 6 7 8 10 11 18 1 0 19 3 2 Notation 0 Engine start 1 Start taxi 2 Start takeoff 3 Initial climb 4 Initial cruise 5 Start pre-strike refuel 6 End pre-strike refuel Start cruise 7 End cruise, start loiter 8 End loiter 9 Start ingress 10 End egress,combat 11 Weapon release 12 Turn 13 Start egress 14 End egress, start cruise 15 Start post-strike refuel 16 End post-strike refuel 17 End cruise 18 Start hold 19 End hold Putting it all together 2002 LM Corporation WAS mission definition See Lesson 21 – performance WAS MISSION Engine start + taxi time = 30 min Start + taxi thrust level = 10% Takeoff (max thrust time) = 1 min Climb + cruise out distance = 255nm Cruise altitude = 27.4Kft Cruise speed = TBD Ingress/egress altitude = n/a Ingress/egress speed = n/a Ingress/egress dist. = 0 Cruise back distance = 255 nm Landing loiter time = 1 hr Landing fuel reserves = 5% 24-21
Design of UAV Systems 12 13 14 17 16 15 4 9 5 6 7 8 10 11 18 1 0 19 3 2 Notation 0 Engine start 1 Start taxi 2 Start takeoff 3 Initial climb 4 Initial cruise 5 Start pre-strike refuel 6 End pre-strike refuel Start cruise 7 End cruise, start loiter 8 End loiter 9 Start ingress • 10 End egress,combat • Weapon release • 12 Turn • 13 Start egress • 14 End egress, start cruise • 15 Start post-strike refuel • 16 End post-strike refuel • 17 End cruise • 18 Start hold • 19 End hold Putting it all together 2002 LM Corporation ID mission definition • POSITIVE ID MISSION • Engine start + taxi time = 30 min • Start + taxi thrust level = 10% • Takeoff (max thrust time) = 1 min • Climb + cruise out distance = 200nm • Cruise altitude = 10Kft • Cruise speed = TBD • Ingress/egress altitude = 10Kft • Ingress/egress speed = 282 kts • Ingress/egress dist. = N282 nm • where N = number of searches • Cruise back distance = 200 nm • Landing loiter time = 1 hr • Landing fuel reserves = 5% 24-23
Design of UAV Systems Putting it all together 2002 LM Corporation Review - spreadsheet model • Configurations are defined in absolute and relative terms • Payload weight, volume and number of engines are described in absolute terms (forebody, aftbody and length are relative to diameter) • Fuselage diameter can be input as an absolute value or as a variable to meet volume requirements • - Aero and propulsion parameters (Cfe, e, Fsp0, f/a, etc.) are defined as absolute values • - Everything else (wing, tails area, engines, nacelles,etc.) is defined in relative terms (AR, W0/Sref, BHp0/W0, Sht/Sref, BHp0/Weng, Waf/Sref, UWW, etc.) • Missions are described in absolute terms • Takeoff times, operating radius, speed, altitude, etc • Most variables are input via worksheet Overall, some are input via worksheet Mperf • - Mperf inputs are used to converge the overall solution 24-24
Design of UAV Systems Putting it all together 2002 LM Corporation Overall worksheet inputs • 48 Nacelle k1 0.2 • 49 Nacelle k2 0.4 • 50 Nacelle w/h 1.0 • 51 Nacelle Swet fract. 0.5 • Nac. Non-prop PF 0.0 • 54 Number of pods 0 • 55 Pod offset/(b/2) n/a • 56 Pod D-eq/Df-eq n/a • 57 Pod L/D-eq n/a • 58 Pod k1 n/a • 59 Pod k2 n/a • Pod w/h n/a • Pod PF 0.0 • 65 Taper ratio 0.5 • 66 Thickness ratio 0.13 • 67 Tank chord ratio 0.5 • 68 Tank span ratio 1 0.1 • 69 Tank span ratio 2 0.9 • 72 Horiz tail area 0.39 • 73 Vert tail area 0 • 75 Skin frict coef .0035 • 76 Oswold efficiency 0.8 • 77 Fuse drag factor 1.0 • Wing drag factor 1.0 • 81 # of engines 1 82 Model Bhp0 default 83 Eng Fsp 90 84 Fan (prop) Fsp 5 85 Ref speed (kts) 50 86 Bypass ratio 133 87 Prop efficiency 0.8 88 Fuel/air ratio default 89 Engine L/D-eq 2.5 92 Starting W0 default 93 Engine Hp0/Weng 2.25 94 Eng. inst. wt. factor 1.3 95 Land gear fraction .05 96 System + wt.fract. 0.12 97 Fuse+nac unit wt. 1.8 98 Wing unit wt. 3.25 99 Horiz tail unit wt. 2.6 100 Vert. Tail unit wt. 2.6 101 Empty wt. margin .05 102 Misc. wt. Fraction .02 104 Fuel density 50 105 Fuel PF 0.8 106 Engine rho (unst’l) 22 107 LG rho (instal) 25 108 System + rho (inst’l)25 109 Payload rho (inst’l) 27.12 • RowDescriptionValue • 08 Volume margin 1.3 • 09 Headwind (kt) 0 • Climb V/Vstall 1.25 • 11 Loiter V/Vstall 1.1 • 13 Idle time (min) 30 • 14 Idle power (%) 10 • 15 Takeoff time (min) 1 • 16 Takeoff param 220 • 17 Takeoff CL 1.5 • 18 Takeoff altitude 0 • 31 Landing loiter (min) 60 • 32 Landing reserve .05 • 34 # of fuselages 1 • 35 Fuse. offset/(b/2) 0 • 36 Df (starting value) 2.29 • 37 Lf/Df-equiv 7 • 38 Fuselage k1 .143 • 39 Fuselage k2 .286 • 40 Fuselage w/h 1 • 41 Forebody PF 0.7 • 42 Centerbody PF 0.7 • 43 Aftbody PF 0.7 • 46 Ln/Dn-eq 5 • 47 Dn-eq/Dengine 1.25 24-25
Design of UAV Systems Putting it all together 2002 LM Corporation Mperf worksheet inputs - WAS • RowDescriptionValue • h4 (kft) 27.4 • h7-cruise (kft) 27.4 • h7-loiter (kft) 27.4 • h8-loiter (kft) 27.4 • h9-10,13-14 (kft) 27.4 • h11-12 (kft) 27.4 • h14 (kft) 27.4 • h17 (kft) 27.4 • V-cruise 180 • V-ingress (& egress) 282 • Op dist (nm) 255 • Ingress/egress (nm) 0 • Combat (min) 0 • Max climb M 0.48 • T factor (cruise&clmb) 1 • T factor (op loiter) 1 • T factor (ingress/combat) 1 • SFC factor (cruise&clmb) 1 • SFC factor (op loiter) 1 • SFC factor (ingress/cmbt) 1 • Drag factor 1 • Airframe weight factor 1 • Fus+nac Swet factor 1 Design mission definition • RowDescriptionValue • 52 Df-equiv 0 – to iterate • 2.29 – fixed Df • 56 W0/Sref 30 • 57 Fuel fraction TBD • 58 Additional fuel 0 • 61 Bhp0/W0 TBD • 64 Payload retained (lbm) 720 • 65 Payload dropped (lbm) 0 • Aspect ratio 20 • Wing efficiency (e) 0.8 24-26
Design of UAV Systems Putting it all together 2002 LM Corporation Mperf worksheet inputs - ID • RowDescriptionValue • h4 (kft) 10 • h7-cruise (kft) 10 • h7-loiter (kft) 10 • h8-loiter (kft) 10 • h9-10,13-14 (kft) 10 • h11-12 (kft) 10 • h14 (kft) 10 • h17 (kft) 10 • V-cruise 180 • V-ingress (& egress) 282 • Op dist (nm) 200 • Ingress dist.(nm) 141 • Combat (min) 0 Secondary mission definition • RowDescriptionVa • 58 Additional fuel 0.0 • 64 Payload retained (lbm) 720 • 65 Payload dropped (lbm) 0 • Aspect ratio 20 • Wing efficiency (e) 0.8 • Lamda 0.5 24-27
Design of UAV Systems Putting it all together 2002 LM Corporation Initial sizing • The spreadsheet iterates the air vehicle to meet input weight, geometry,volume and propulsion requirements • Bottoms-up weights must be iterated by definition • Geometry is adjusted with each weight iteration to maintain proper fuselage-wing-tail relationships • Engine and nacelle size is adjusted as required • Waf/Sref and volume required/available are the variables used to converge weight and geometry during iteration • Waf/Sref is used as an input to the weight model and an output from the geometry model • Fuselage diameter is adjusted to meet volume required • When the values converge, mission model performance estimates will be valid, even though… • - Mission range may be short (or long) • - Climb rate may be inadequate (even negative) • Cl may be too high (exceeding stall margins) 24-28
Design of UAV Systems Putting it all together 2002 LM Corporation Speed and performance margins • Civil/military certification requirements and good operating practice specify that certain speed and performance be mainatined. Typical values • Takeoff (V/Vstall 1.1) • Climb (V/Vstall 1.20) • Cruise (V/Vstall not defined) • Landing approach (V/Vstall 1.2-1.3) • Service ceiling = 100 fpm • UAVs have not yet established criteria but safety and good practice will dictate something similar • One difference will be operational loiter speed margin, to get high LoD we need to operate at V/Stall 1.1 • For design project purposes, we will apply the above margins except we require enough thrust margin for 300 fpm (Ps = 5 fps) 24-28a
Design of UAV Systems Putting it all together 2002 LM Corporation Performance convergence • Worksheet Mperf accepts new inputs to improve or adjust performance • Fuel fraction (FF) is adjusted to meet range and/or endurance requirements • Bhp0/W0 or T0/W0 is adjusted to meet takeoff or rate of climb requirements or achieve consistency (see below) • W0/Sref is adjusted to improve LoD or takeoff distance • AR and wing efficiency (e) can also be traded to improve overall performance • The values are adjusted by hand until a satisfactory solution is achieved • This includes ensuring adequate (and consistent, if configurations are being compared) margins such as residual ROC, T-D and stall margin • Bhp0/W0 or T0/W0 is further iterated to achieve the desired level of consistency 24-29
Design of UAV Systems Column B Column C Df-equiv 3.04 3.04 Waf/Sref - geom 13.25 13.25 Waf/Sref 13.25 13.25 b 40.6 40.6 W0 3304 3304 W0/Sref 40.00 40.00 FF 0.1989 0.199 Wfuel (total) 657 657 Wing fuel @ 50 ppcf 185 185 Remaining fuel volume req'd (cuft) 9 Fuselage center section vol (cuft) 88 Pod volume (cuft) 0 Wpay 707 707 Wpay (dropped) 0 0 WE 1912 1913 Bhp0/W0 0.121 0.121 TOP Bhp0/W0 req'd 0.121 0.121 Bhp0 400 400 Sref 83 83 Swetfpppn 210 210 Swet 422 422 AR 20.00 20.00 Neng 1 1 Bhp0 req'd (ea) 400 400 TBP model Bhp0 (ea) 2111 2111 ESF req'd 0.189 0.189 Vol-eng(ea) 8.1 8.1 D-eng 1.60 1.60 D-nac 2.00 2.00 Putting it all together 2002 LM Corporation Spreadsheet demonstration Notional values 24-30
Design of UAV Systems Putting it all together 2002 LM Corporation Spreadsheet results • Engine size mismatch for WAS and ID mission • Negative Ps at 10 Kft, 282 Kt - requires Bhp0/W0 increase to 0.10 • Cruise speeds near LoDmax yielded best performance • 161 kts for WAS @ 17 Kft, 144 kts for ID at 10Kft • Positive ID was the driving mission • Baseline 12 hour operational endurance WAS air vehicle sized to W0 = 3304 lbm, EW = 1912 lbm • For 12 IDs in 12 hrs, W0 = 16534 lbm, EW = 7996lbm • Also required increased diameter fuselage (to 4.5 ft) to accommodate additional fuel required • Changing wing loading (W0/Sref) yielded little benefit • Higher: loiter and cruise speeds offset smaller wing • Lower: increased wing size offset smaller engine • Changing aspect ratio (AR) was of little benefit • Increased AR (25) yielded small weight improvement Earlier example problem 24-31
Design of UAV Systems D D Side Side Putting it all together 2002 LM Corporation WAS concept W0 = 3080 lbm EW = 1744 lbm AR = 20 Sref = 77sqft Swet = 381 sqft Payload = 707 lbm Fuel = 603 lbm Power = 373 Bhp TBProp Max endurance = 15.3 hrs Max speed = 350+ kts Note – not to scale 39.2’ Earlier example problem This air vehicle can stay on station at 17Kft for 12 hours at an operating radius of 255 nm 2.82’ 19.7’ 24-32
Design of UAV Systems 90.9’ 4.78’ D D Side Side 33.5’ Putting it all together 2002 LM Corporation ID concept W0 = 16534 lbm EW = 7996 lbm AR = 20 Sref = 413 sqft Swet = 366 sqft Payload = 707 lbm Fuel = 7660 lbm Power = 2000 Bhp TBProp Max endurance = 57.3 hrs Max speed = 350+ kts Note – not to scale Earlier example problem This air vehicle can perform 12 IDs in 12 hours at 10Kft at an operating radius of 200 nm 24-33
Design of UAV Systems Putting it all together 2002 LM Corporation Parametric comparisons • During every step of the PCD process, we always test our performance estimates vs. data on known aircraft • This is essential to ensure our results make sense • Critical comparisons for our concept are defined by Breguet range and endurance equation variables • LoD, SFC and weights (airframe, propulsion and EW) • LoD comparison • We would compare our estimates to RayAD Fig 3.5 but our vehicle is beyond Raymer’s parametric range • For AR=20, Sref = 77, Swet = 381 and Sref = 413, Swet = 1614 our “wetted ARs” (A/[Swet/Sref]) = 4.0 and 5.1 vs. Raymer’s maximum value of 2.4 • But from the trend of the data our assessed values of LoDmax = 27-30 look slightly optimistic • We can also compare to Global Hawk with a reported LoDmax of 33-34 at an estimated “wetted AR” 7 24-34
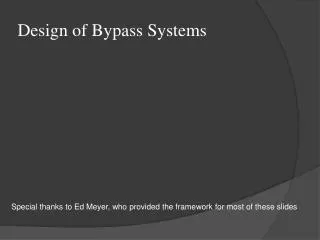
Design of UAV Systems Maximum L/D trends 35 30 25 20 (L/D)max 15 10 5 Manned aircraft Global Hawk (est) 0 0 2 4 6 8 Wetted AR = b^2/Swet Putting it all together 2002 LM Corporation LoD comparison • This data shows that our model LoDmax estimate may be optimistic by about 5% • We will put a 10% multiplier on our Cdmin estimate • to correct for it (Cell B25 = 1.1) • Why do you suppose we corrected a 5% high LoD estimate by increasing minimum drag by 10%? • Could we have done it another way? Model estimate Corrected value Manned aircraft data source : LM Aero data handbook 24-35
Design of UAV Systems • This data shows that our model SFC estimates are within performance bounds for 2 typical turboprops* • Although 250 kts at 10Kft looks a little optimistic Data source : Roskam A&P Putting it all together 2002 LM Corporation SFC comparisons Data source : Roskam A&P * Note – turboprop SFC is defined in terms of horsepower. Our turboprop model converts horsepower to thrust and uses TSFC for performance calculations 24-36
Design of UAV Systems Global Hawk TR-1 TR-1 Putting it all together 2002 LM Corporation Weight comparisons • This data shows that our calculated weights are low compared to regional turboprops but high compared to U-2 and Global Hawk • - But the results are close enough for now • Another weight related issue is operating a high AR wing at 280 kts at low altitude (flutter and gust potential) 24-37
Design of UAV Systems Putting it all together 2002 LM Corporation Final comparison GA Altair (Predator B variant) W0 = 7000 lbm EW = ? Sref = 315 sqft AR = 23.5 Payload = 750 lbm Fuel = 3000 lbm Power = 700Hp TPE-331-10T Endurance = 32 hrs Max speed = 210 kts With these inputs our concept would have a 49 hour endurance at 50 Kft but require a 45% airframe weight reduction 24-38
Design of UAV Systems Putting it all together 2002 LM Corporation Overall conclusions • Data comparison shows that our model estimates are reasonable, although some are probably optimistic • We have already decided to put a factor on our drag estimates to reduce LoDmax to the data trend line • We will also should put a 10% multiplier on ingress-egress SFC to put it in the middle of the parametric range • But we will have to wait for conceptual design to see if our weights are optimistic or pessimistic • Some people, however, will put on additional margins to ensure early estimates will be achievable • Typically 5-10% on SFC and drag and 10-20% on weight • Putting additional margins on our estimates, however, should not be necessary since our parametric data already shows they should be generally achievable • Adding more margin would be overly conservative and negate otherwise valid design solutions 24-39
Design of UAV Systems 39.9’ 7.9’ 2.0’ 2.85’’ D D Side Side 19.95’ Putting it all together 2002 LM Corporation Adjusted baseline Note – not to scale W0 = 3178 lbm EW = 1792 lbm AR = 20 Sref = 79 sqft Swet = 391 sqft Payload = 707 lbm Fuel = 651 lbm Power = 384 Bhp TBProp Max endurance = 15.3 hrs Max speed = 350+ kts Earlier example problem This air vehicle has 10% drag and 280 Kt SFC multipliers and can stay on station for 12 hours at 17Kft or perform 2.8 ID missions at 10Kft in 2.8 hours 24-40
Design of UAV Systems Putting it all together 2002 LM Corporation Balancing mission requirements • Since size requirements for vehicles to do the WAS and ID missions are so different, we will do a study to determine which size vehicle can do both missions at the lowest cost using the following approach: • Size WAS concepts for 6, 12, 24 and 48 hours of loiter • ID mission performance will be a fallout • We will then calculate the number of aircraft required for 24/7 surveillance for 30 days for both missions • We will do simple weight based cost estimates • Air frame and systems less installed propulsion: $ 200/lbm EW-Weng for ICProp (Lesson 8-45), $400 for TBProp, $800/lb for TBFan • Payload: $5000 per pound • Engine : $150/lbm for ICProp, $700/lbm for TBProp, $1000/lb for TBFan • Finally we will do a simple cost effectives comparison to select our preferred size concept 24-41
Design of UAV Systems Putting it all together 2002 LM Corporation WAS sortie rate elements • In order to estimate number of aircraft required we have to perform a preliminary sortie rate analysis • See Lesson 7 (Sortie Rate) chart 10, • We will use the maintenance and planning times in chart SRR-10 as representative values • The nominal mission ground times required are: • Maintenance and flight preparations – 180 minutes • Preflight checks - 6 minutes • Post landing checks and taxi - 25 minutes • The remaining elements of the sortie are • Engine start-taxi-takeoff - 31 minutes • Time to climb to 17 Kft – 6.7 minutes • Outbound and return cruise time - 184 minutes • WAS - 6, 12, 24 or 48 hours • Landing loiter – 60 minutes • Land – 3 minutes • Use RAND data and adjust for UCAV vs. UAV • Include maintenance time = f(flight hrs) 24-42
Design of UAV Systems TAT 3 hrs Putting it all together 2002 LM Corporation Sortie rate elements UCAV unique Include in flight time • Therefore: • SR(UAV) 24hours/[1.68FT + 4.9] • SR(UCAV) 24hours/[1.68FT + 5.9] * http://www.rand.org/publications/MR/MR1028/ 24-42a
Design of UAV Systems Putting it all together 2002 LM Corporation ID sortie rate elements • The ID mission sortie is identical to the WAS mission except for the flight times where the spreadsheet values are: • Time to climb to 10 Kft – 3.5 minutes • Outbound and return cruise time - 163 minutes • ID’s = 1 hour each Earlier example problem Still valid Still valid 24-43
Design of UAV Systems Putting it all together 2002 LM Corporation WAS coverage requirements • Time required to fly a WAS sortie are: • 6 hr loiter - 496 min. + 6 hrs = 14.26 hrs • 12 hr loiter - 20.26 hrs • 24 hr loiter - 32.26 hrs • 48 hr loiter - 56.26 hrs • The number of missions an air vehicle can fly in 30 days vs. the number required, therefore, are: • 6 hr loiter - able to fly 50.5 missions vs. 480 required • 12 hr loiter - can fly 35.5 missions vs. 240 required • 24 hr loiter - can fly 22.3 missions vs. 120 required • 48 hr loiter - can fly 12.8 missions vs. 60 required • The number of flight vehicles required, therefore, are: • 6 hr loiter - 480/50.5 = 9.5 10 • 12 hr loiter - 240/35.5 = 6.8 7 • 24 hr loiter - 120/22.3 = 5.4 6 • 48 hr loiter - 60/12.8 = 4.7 5 Earlier example problem 24-44
Design of UAV Systems Putting it all together 2002 LM Corporation WAS air vehicles required • The total number of air vehicles required are greater than the number required to meet flight requirements • We assume one air vehicle is always on standby in case one of the flight vehicles has a problem • And we assume all vehicles vehicle under go maintenance at rate of 3.4hrs + 0.68*Flight Time • The total number of air vehicles required for continuous WAS mission coverage, therefore, are: • 6 hr loiter - 10 + 1 = 11 • 12 hr loiter - 7 + 1 = 8 • 24 hr loiter - 6 + 1 = 7 • 48 hr loiter - 5 + 1 = 6 Earlier example problem 24-45
Design of UAV Systems Putting it all together 2002 LM Corporation WAS air vehicle cost • At a nominal air vehicle cost of $400 per pound of empty weight and a nominal payload cost of $5000 per pound, we can calculate WAS costs as follows: • 6 hr loiter - 12 air vehicles = $6.6M, Payloads = $38.9M • Total cost = $45.4M • 12 hr loiter - 9 air vehicles = $5.7M, Payloads = $28.3M • Total cost = $34.0M • 24 hr loiter - 8 air vehicles = $7.3M, Payloads = $24.7M • Total cost = $32.1M • 48 hr loiter - 7 air vehicles = $16.9M, Payloads = $21.2M • Total cost = $38.1M • Earlier example problem • You should include engines as separate cost element 24-46
Design of UAV Systems Putting it all together 2002 LM Corporation ID mission requirements • Assuming one target identification per hour, the times required to fly an ID sortie are: • 1 ID – 471.5 minutes + 1 hrs = 8.86 hrs • 2 IDs - 9.86 hrs • 4 IDs - 11.86 hrs and 8 IDs - 15.86 hrs • The number of missions an air vehicle can fly in 30 days vs. the number of IDs required are: • 1 ID – able to fly 81.3 missions vs. 720 required • 2 IDs - can fly 73.0 missions vs. 360 required • 4 IDs - can fly 60.7 missions vs. 180 required • 8 IDs - can fly 45.4 missions vs. 90 required • The number of flight vehicles required, therefore, are: • 1 ID - 720/81.3 = 8.85 9 • 2 IDs - 360/73.0 = 4.93 5 • 4 IDs - 180/60.7 = 2.96 3 • 8 IDs - 90/45.4 = 1.98 2 Earlier example problem 24-47
Design of UAV Systems Putting it all together 2002 LM Corporation Equivalent WAS coverage • WAS sortie equivalent IDs are: • 6 hr loiter = 1.5 IDs • 12 hr loiter = 2.8 IDs • 24 hr loiter = 5.1 IDs • 48 hr loiter = 9.5 IDs • The number of ID missions a WAS air vehicle can fly in 30 days vs. the number required, therefore, are: • 1.5 IDs - can fly 76.8 missions vs. 478.9 required • 2.8 IDs - can fly 67.7 missions vs. 261 required • 5.1 IDs - can fly 55.4 missions vs. 141.2 required • 9.5 IDs - can fly 41.4 missions vs. 75.9 required • Total number of ID vehicles required, therefore, are: • 6 hr loiter or 1.5 IDs - 478.9/76.8 = 6.2 8* • 12 hr loiter or 2.8 IDs - 261/67.7 = 3.9 5* • 24 hr loiter or 5.1 IDs - 141.2/55.4 = 2.5 4* • 48 hr loiter or 9.5 IDs – 75.9/41.4 = 1.8 3* * If WAS and ID vehicles are identical, a 2nd back up is not required Earlier example problem 24-48
Design of UAV Systems Putting it all together 2002 LM Corporation ID air vehicle cost • At a nominal air vehicle cost of $400 per pound of empty weight and a nominal payload cost of $5000 per pound, ID costs are: • 1.5 IDs – 8 air vehicles = $4.2M, Payloads = $24.7M • Total cost = $29.0M • 2.8 IDs - 5 air vehicles = $2.9M, Payloads = $14.1M • Total cost = $17.0M • 5.1 IDs – 4 air vehicles = $3.1M, Payloads = $10.6M • Total cost = $13.7M • 9.5 IDs – 3 air vehicles = $5.6M, Payloads = $7.1M • Total cost = $12.7M Earlier example problem 24-49