Download
1 / 47
611 likes | 1.68k Vues
Lecture 13a Soil Fertility – N-P-K. The study of supplying plant nutrients from the soil. Understanding CEC is the single most important concept in understanding soil fertility. (However soil pH is the most important chemical property)

E N D
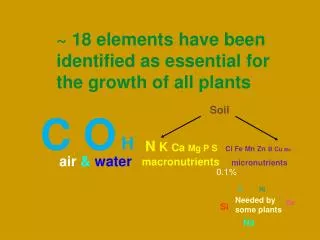
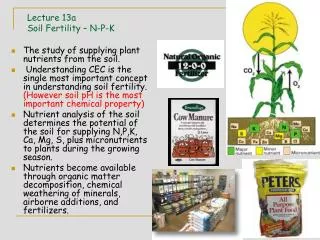
Lecture 13aSoil Fertility – N-P-K • The study of supplying plant nutrients from the soil. • Understanding CEC is the single most important concept in understanding soil fertility. (However soil pH is the most important chemical property) • Nutrient analysis of the soil determines the potential of the soil for supplying N,P,K, Ca, Mg, S, plus micronutrients to plants during the growing season. • Nutrients become available through organic matter decomposition, chemical weathering of minerals, airborne additions, and fertilizers.
Fertilizer Plant Fertilizers • Manufactured fertilizers have been used for over a 100 years. • The numbers on a bag of fertilizer--"10-5-5", = guaranteed chemical analysis. • These numbers indicate the bag of fertilizer contains: • 10% N, • 5% P2O5, • 5% K2O. • These numbers--"10-5-5“ = the fertilizer grade. • Fertilizer ratio - proportion of primary nutrients (N-P2O5-K2O) in a fertilizer grade, divided by the highest common divisor; or • 10 ÷ 5=2, so the ratio of this fertilizer is 2-1-1.
For phosphorus and potassium, the chemical analysis is given in the oxide form. • This is the way the nutrients were first thought to be absorbed by the plant and is still used today to express the analysis of fertilizer. • For a grade of 18-24-12 elemental analysis = 18- 10.5 - 10 • The elemental analysis can usually be found on the bag near the fertilizer grade. • To convert from the elemental analysis to the chemical analysis for phosphorous and potassium fertilizers, use this formula: • % P2O5 x .44 = %P • % K2O x .83 = %K
Converting P2O5 & K2O (oxide from) into P and K (elemental form) • % P2O5 x .44 = %P (or there is 44% P in P2O5) • & • %P x 2.29=%P2O5 • %K2Ox.83=%K ( or there is 83% K in K2O ) • %K x 1.2=%K2O • For Example: A 30 pound sack of fertilizer (25 - 5 - 5) , is applied to your garden. • The amount of N applied=.25 x 30=7.5 lbs N • amount of P205 applied=.05 x 30=1.5 lbs & P=.44 x 1.5=0.66 lbs P • amount of K20 applied=.05 x 30=1.5 lbs & K=.83 x 1.5=1.245 lbs.K
Dyad = If you apply a 14 lb sack of 22-3-14 how many pounds of N, P2O5, and K2O did you apply? • N– 14 x .22 =3.08 • P2O5– 14x .03 =0.42 • K2O– 14 x .14 =1.96
Soil Fertility • Nitrogen Fertilizer - management of Nitrogen requires an understanding of the Nitrogen Cycle. • Nitrogen is dynamic in the soil and forms of N will change depending on the soil conditions. Reed Palm – N Def on left
Nitrogen • NH4+ and NO3- forms taken up by plants • Loss of N can occur: 1) leaching of NO3- , 2) volatilization of NH4+ to NH3 (high pH soils), • 3) immobilization by plant or microbe uptake, • 4) Denitrification
Fertilizer Nitrogen • Nitrogen fertilizer should be added to the soil when the crop will use it, adding excess N will cause losses that may harm the environment. • Keep N & P out of water bodies by only applying it to soils that need the nutrients. • Nitrogen is expensive and using only what the crop needs for adequate growth is important Wheat with N response
N Fertilizer Rate and Application • Rate of N application is the management practice that most influences nitrate concentrations in the tile drainage water. • Reducing the N rate by 33% ( to 80 lbs N) from the recommended 120-lb N rate for corn after soybeans decreased the nitrate-N concentration in the subsurface, drainage water by • 2.6 mg/L (14%) • and decreased corn yield by 25 bu/A (16%). http://www.ewg.org/reports/deadzone/top10.php
On the other hand, increasing the N rate by 33% above the fall-applied 120-lb rate, increased nitrate-N concentration by 4.3 mg/L (23%) but increased yield only 9 bu/A (6%). • Time of application studies showed nitrate-N losses from a corn-soybean rotation to be ranked • fall N > split(fall and spring) N > spring N = fall N with a nitrification inhibitor. • From G. Randall,2004 U.S. Geological Survey, 1993; 26-38.
Alfalfa and grass CRP effectively filter tile drain water Randall et al., 1997
Nitrogen soil testing • NO3- Mobile nutrient • In drier areas use a fall or spring nitrate-N soil test. • In humid areas, use spring nitrate-N test or table value based on previous crop and organic matter. • The amount of rain after the soil test may determine if the NO3- tested for has been leached below the root zone.
Nitrogen Credits • Once the amount of N needed for the plant is determined - • N credits need to be taken for: • Previous crop • Previous manure applications or sludge • 2nd year after alfalfa
THUS it becomes important to give N - CREDITS for previous management activities. • legumes, manure or other organic additions with low C:N ratios are adding N to the soil • Thus this organic N needs to be counted into the total N available for crop growth • And thus reduce the need for fertilizer N. Cow Manure Green Manure
Price of N P K • 2005 2006 2007 2008 2009 2010 • NH3 - .26 $/lb N .32 .32 .47 .42 .31 • Urea -.37 $/lb N .40 .50 .60 .52 .49 • P2O5 -.33 $/lb P .36 .46 .88 .71 .56 • K2O - .20 $/lb K .23 .27 .47 .71 .42 Source- http://www.ers.usda.gov/data/fertilizeruse/
P - Fertility Phosphorus is low in total amount in the soil and low in solubility and is readily fixed by Fe and Al at low pH and Ca at high pH. H2PO4- and HPO4-- forms taken up by plants P Fertilizer is made from rock phosphate Rock phosphate mines are in Florida & South Carolina
Soybean Yields with P fertilizer • _______________________Yield bu/acre___ • Lbs P fertilizer added Waseca Lamber. • 0 31 27 • 23 33 29 • 46 35 30 • 69 36 30 • 92 37 32 Ridge Till Soybeans
P • Soil test for P (Bray pH<7.4 of soil) • 0-5 ppm = very low • 6-10 ppm = LOW • 11-15 ppm = med • 16-20 ppm = high • > =21 ppm = very high • No reason to have soil test > 21 • environmental problems when P >16 • ppm x 2 = lbs/acre P deficient tomato
Soil P • Crops need more P than is dissolved in the soil solution at any one time, therefore, this P in the solution phase must be replenished many times during the growing season. • The ability of a soil to maintain adequate levels of phosphorus in the solution phase is the key to the plant available P status of the soil. The solid phase P is both organic and inorganic P deficiency reduces root growth Solid P Phase Solution Phase Root Hair
Potassium Fertility (Potash) • Potassium (K+) is a problem on • acid soils, • soils with low CEC • soils with irrigation or high rainfall where leaching can readily occur. • Potassium can be stored in the soil from one year to the next • K is not a pollutant - even if leached from soil, K does not cause environmental problems. K deficient corn
K • Different crops have different K requirements • Soil test : • 0-40 ppm = very low 40 – 80 ppm = low 80 120 ppm = medium 120 – 160 ppm = high > 160 ppm = very high • ( > 160 = no K needed) K deficient soybeans
Potassium Feldspar Mineral • Potassium is found in minerals like feldspars and micas (90% of Soil K) • K is fixed inside of clay minerals ( 9% of soil K) • K is on the soil exchange sites ( 1%) • K is in the soil solution (0.1%) • Annual K Recommended for 160 bu corn yield goal • Soil Test CEC • 10 20 30 • 50 130 150 170 • 150 90 110 130 • 250 50 70 90 • _______________________________________
Ca, Mg • Calcium and Mg - when soils are low in Ca, Mg, they have a pH problem and by adding lime or dolomite the pH and Ca, Mg problem is corrected. • On some acid, sandy soils Mg deficiency on corn has been noted. 15 lbs as a starter or 75 lbs broadcast corrected the problem. Magnesium deficiency on corn
S • Sulfur - Most soils in Mn would not respond to additions of Sulfur because of adequate levels and atmospheric deposition. • However, on sandy soils in NE Minnesota yields have increased with 25 lbs/Acre to Alfalfa, Corn and Small grains.
Sample Fertilizer Problem- For your notes • Nutrient Analysis - N - P - K = N -P2O5 - K2O • % P = .44 x %P205 & %K = %K20 x .83 • If you apply 25 lbs of P205 how much elemental P did you apply, 25 x .44 = 11 lbs P • Fertilizer Bag = 20 - 5 - 10 = • 20% N, 5% P20%, 10% K20 • If you apply 50 lbs of fertilizer you put on ? • .20x50 = 10 lbs N, • & .05 x 50 = 2.5 lbs P205 and 1.1 lbs of P, • & .1 x 50 = 5 lbs K20 and 4.15 lbs K.
If you need 85 lbs of N for Corn how many lbs of this fertilizer(20-5-10) do you need? • 85/.20 = 425 lbs fertilizer • How many lbs of elemental K will you apply with the 85 lbs of N. • 425 x .1 = 42.5 lbs K20 and 42.5 x .83=35.275 lb.K
Iron - Fe Boron - B Zinc - Zn Copper - Cu Molybdenum - Mo Chlorine – Cl Manganese - Mn *Cobalt Co *Nickel- Reasons why use of micronutrients has increased in recent years: Increased knowledge of their role in plant nutrition, deficiency symptoms in plants, and behavior in soil. Higher crop yields which have increased micronutrient needs. Improved analytical methods, resulting in more soil tests and improved fertilizer recommendations. Improved sources of micronutrient fertilizers and methods of incorporation into other fertilizers. Land-shaping practices, such as terracing or land leveling for irrigation, which remove topsoil containing organic matter, often associated with most of the available micronutrient supply. (Reference: The Fertilizer Handbook / The Fertilizer Institute - pp 91-92) Micronutrients grape leaf symptoms of boron deficiency; right: boron toxicity)
Role of Micronutrients • Boron is believed to be involved in carbohydrate transport in plants; it also assists in metabolic regulation . • Chlorine is necessary for osmosis and ionic balance; it also plays a role in photosynthesis. • Zinc participates in chlorophyll formation, and also activates many enzymes • Copper is a component of some enzymes and of vitamin A. • Iron is essential for chlorophyll synthesis, which is why an iron deficiency results in chlorosis. • Manganese activates some important enzymes involved in chlorophyll formation • Molybdenum is used by plants to reduce nitrates into usable forms • *Cobalt is thought to be an important catalyst in nitrogen fixation. It may need to be added to some soils before seeding legumes. • *Nickel has only recently been shown to be an essential nutrient for plants. Ni-deficient conditions, barley plants fail to produce viable grain because of a disruption of the normal grain-filling and maturation processes.
Micronutrients • Correcting pH problems for most soils will correct micronutrient deficiencies • Most common deficiency is Iron on alkaline soils for those plants that like acid conditions. Fe Deficiency on rhododendron, Fe deficiency on pin oak
Nutrient Management • Need to manage nutrients • Plant growth • Feed the world • Economic • Aesthetic • Environmental • N in drinking water • Hypoxia Gulf of Mexico • Eutrophication of fresh waters Jubilees (oxygen-deficient waters) occur in coastal areas around the world, as a result of excessive nutrients (particularly nitrogen) flowing from rivers into oceans.
Justus von Liebig’s Law of Minimum • Plant production can be no greater than that level allowed by the growth factor present in the lowest amount relative to the optimum amount for that factor
Tools for detecting nutrient deficiency • 1) Tissue testing -involves a complete and detailed laboratory analysis of nutrient elements in the plant leaves. This is a very accurate way of assessing how much nutrient the plant has actually taken up from the soil. • Recommendations are made on the basis of these test results: • Backed by research • Dependent on plant growth stage and plant part.
Soil testing • Collecting a soil sample to determine the current nutrient status of the soil.
Sufficiency Method of Nutrient Needs • Uses soil testing to predict fertilizer needs. • Based on green house and field research. • Soil test is a predictive tool. • Gives soil credit for it’s nutrient providing ability.
Correlation • Process used to determine if • a soil nutrient, as extracted by a soil test, • and crop response to added nutrient, are so related that one directly implies the other.
Exploratory fertilization trial Greenhouse – a controlled environment with soil homogeneity. • Trials in field with selected soils not as controlled but needed to verify greenhouse trials.
Determine percentage yield values for each fertilizer rate trial. • Determine soil test values for nutrient being studied. • Plot percentage yield vs soil test value.
Improving soil fertility the 'green' way • Importance of expanding the use of agricultural production methods that are both agronomically and economically sustainable. Legume intercropped with maize in Wenchi, Ghana, Africa
What is the earth showing us? The End