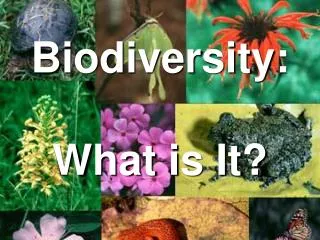
Biodiversity is unevenly distributed
Biodiversity is unevenly distributed. Erik Rauch (NECSI, MIT) Yaneer Bar-Yam (NECSI) ICCS 2004. Species diversity not distributed uniformly Within-species diversity also important Resistance to disease Future environmental changes: diversity = evolutionary potential. Overview.

Biodiversity is unevenly distributed
E N D
Presentation Transcript
Biodiversity isunevenly distributed Erik Rauch (NECSI, MIT) Yaneer Bar-Yam (NECSI) ICCS 2004
Species diversity not distributed uniformly • Within-species diversity also important • Resistance to disease • Future environmental changes: diversity = evolutionary potential
Overview • Simple genealogical model: • Genetic distinctiveness is unevenly distributed in populations • Prediction compared with experimental data • Implications for conservation
How is the diversity in a population distributed within it? A time
How is the diversity in a population distributed within it? time
uniqueness u How is the diversity in a population distributed within it? A time
Diversity model Model genome (bit string) Generation 1 2 3 • Descendants become increasingly different from their ancestors
Measure: number of loci that have more than one allele Measuring diversity Generation 1 2 3 • Any mutation not already found in the population should increase diversity
Assume mutations are random, constant rate Each link is a chance for mutation Generation 1 2 3 4 5
Divergence is proportional to number of links back to common ancestor Generation 1 2 3 4 5
Total diversity: number of links traced back from living population Generation 1 2 3 4 5 Related work: coalescent theory
Account for repeated mutationsif mutation rate large relative to state space large state space (107) 1 mutation per generation diversity Smaller state Space (106) number of links in the tree
Reproduction • Fixed number of sites, each with an individual • Spatial or well-mixed • At each time step, current population replaced by new generation • New individual is offspring of a random neighbor (could also have multiple parents)
uniqueness u Measure of genetic distinctiveness A time
Uniqueness: Number of generations to common ancestor with most closely related group Well-mixed and spatial: P(U>u) ~ u-2 uniqueness u
g: number ofindependently inherited parts of genome uniqueness u
Distribution of uniqueness • Probability that no other lineage jumps to a site: where p(T)N =number of ancestors at time T(well-mixed:2/T), N: number of sites • Probability of uniqueness greater than u: 2 2 2 2
Data from genealogical tree of Pseudomonas soil bacteria (Cho & Tiedje 2000) genetic divergence r
Simulation of sampled population • Lineage of each sample simulated backward in time as random walk • Placed at geographic coordinate corresponding to sample
Uniqueness - comparison with experimental data U(u): number of samples with uniqueness u Distribution is long-tailed U(u) uniqueness u
Distribution of diversity by redundancy just after population loss D(k): number of mutations carried by k members of population 1 10 k Most of the remaining diversity has low redundancy
Much of the remaining diversity disappears within 20 generations D(k): number of mutations carried by k members of population just after reduction after ~20 generations 1 10
Effect of population decline just after reduction after ~20 generations reduced population size
Conclusion • Simple model predicts experimental data • Diversity is unevenly distributed in populations • Conserve diversity by identifying distinctive groups, even just after population loss • Boundaries arise without specific causes