Download

1 / 18
190 likes | 362 Vues
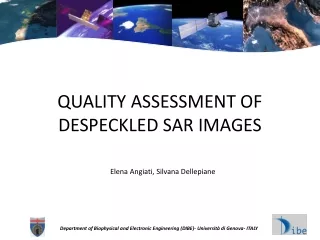
QUALITY ASSESSMENT OF DESPECKLED SAR IMAGES. Elena Angiati, Silvana Dellepiane. Department of Biophysical and Electronic Engineering (DIBE)- Università di Genova- ITALY. Outline. Introduction: despeckling filters and quality assessment of filtered images; The proposed method:

E N D
QUALITY ASSESSMENT OF DESPECKLED SAR IMAGES Elena Angiati,Silvana Dellepiane Department of Biophysical and Electronic Engineering (DIBE)- Università di Genova- ITALY
Outline • Introduction: • despeckling filters and quality assessment of filtered images; • The proposed method: • statistical analysis; • novel frequency analysis. • Experimental results: • Cosmo/Skymed images. • Conclusions
Introductiontospeckle and qualityassesment • Speckle granular aspect of coherent imaging systems. • Speckle reduction before image analysis steps: • feature detection, • segmentation, • classification. • Different methods to assess the filtered image quantitatively. • Results contradictory & no reproduce the human perceptual interpretation.
Methods for despekling • First approach “multi-looking processing”: • linear moving-average filter • blurs edges, decreases the image resolution, and cause a loss in image features. • Different other approaches appeared in the literature Lee, Frost, Kuan and Gamma MAP filters. • More recently the new method of Speckle-Reducing-Anisotropic-Diffusion (SRAD) has been proposed.
Metrics for evaluation of despeckling filters • The best filter has been selected when details and edges have been preserved • Good filter the variance decreased without changing the mean. • Some metrics require a speckle-free image : • important to find metrics not need free-noise image Speckle Suppression Index
Proposed method: Statistical analysis (1) • Metrics & criteria not require original image without noise (metrics presented in literature and two new indexes) M = speckled image; F = filtered image • New parameter: Mean Preservation Index (MPI) • only makes use of the sample mean, computed from a homogeneous region • Speckle Suppression Index (SSI) • The smaller the SSI value the greater the specklesuppressioneffect
Proposed method: Statistical analysis (2) • Speckle Suppression and Mean Preservation Index (SSMPI): • the mean difference between the speckled and filtered image is not normalized higher values for larger backscattering regions. • New index: Mean Preservation Speckle Suppression Index • better comparison of various filters on different images. • the lower values indicate better performance of the filter in terms of mean preservation and noise reduction.
Proposed method: Frequency analysis (1) • Behavior of non linear filters desired properties of good image filters: • zero gain at zero frequency • isotropic behavior. • Non-linear filters are often subject to distortions and artifacts. • No transfer function of a non-linear filter “Equivalent Transfer Function”:
Proposed method: Frequency analysis (2) • Mean-preservation “Static Power Gain” H2(0,0)=ETF(0,0) • Power gain that will be zero decibel for a perfectly preserving filter • Static Power Gain is related to the MPI value • Isotropy behavior 1D plots of Equivalent Transfer Function ETF(kx,0) and ETF(0,ky) • The non monotonically behavior Stop-Band Ripple Amplitude
Experimental results: Dataset • Dataset: Cosmo/Skymed images: • 3 Spotlight (T1, T2, T3) • 2 Stripmap (T4, T5) • Filters used for comparison: • LEE • FROST • ENHANCED LEE • ENHANCED FROST • SRAD (two different parameters configuration) (a) Example: Image acquired in Spotlight mode on April 29th 2009. In red samples used for statistical analysis and in green those used for frequency analysis of (a) “Water” class and (b) “No-Water” class. (b)
Qualitative analysis Original image (a) (b) (c) (d) (e) (f) Filtered images with different filters: (a) Lee, (b) Frost, (c) Enhanced Lee, (d) Enhanced Frost, (e) SRAD with parameters 8-0,5, (f) SRAD with parameters 200-0.01 (g) (h) (i) (l) (m) (n) Corresponding frequency domain of different filters: (g) Lee, (h) Frost, (i) Enhanced Lee, (l) Enhanced Frost, (m) SRAD withparameters8-0,5, (n) SRAD withparameters200-0.01
Experimental results: Statistical analysis (1) Mean Preservation Index for Spotlight images. “Water” and “No-Water” class. Each value is averaged over test samples Speckle Suppression Index for Spotlight and Stripmap images.
Experimental results: Statistical analysis (2) Speckle Suppression and Mean Preservation Index (SSMPI) for Spotlight images. “Water” class Mean Preservation Speckle Suppression Index (MPSSI)for Spotlight images. “Water” and “No-Water” classes.
Experimental results: Frequency analysis (1) Static Power Gain SRAD filter is the best in mean preservation, as also proved by the MPI index. This property is equally verified for “Water” and “No Water” classes Static Power Gain for Spotlight images. “Water” and “No-Water” classes
Experimental results: Frequency analysis (2) ETF analysis along different directions for Spotlight images (T1, T2, T3) (a) (b) (d) (c) (a) ETF(0,ky) for “Water” class; (b) ETF(0,ky) for “No-Water” class; (c) ETF(kx,0) for “Water” class; (d) ETF(kx,0) for “No-Water” class.
Experimental results: Frequency analysis (3) ETF analysis along different directions for Stripmap images (T4, T5) (b) (a) (d) (c) (a) ETF(0,ky) for “Water” class; (b) ETF(0,ky) for “No-Water” class; (c) ETF(kx,0) for “Water” class; (d) ETF(kx,0) for “No-Water” class.
Conclusions • A method for the quality assessment of despeckled SAR images have been presented. • Some new indexes are proposed, together with a new analysis in the frequency domain. • Experiments on real data have been realized different acquisition mode & different acquisition parameters. • The proposed method is here used for the comparison of filters based on anisotropic diffusion, but it can be easily extended to other despeckling filters.
Thank you for your attention! Elena Angiati,Silvana Dellepiane Department of Biophysical and Electronic Engineering (DIBE)- Università di Genova- ITALY