Effective Data Recording with Dot Plots: An Analytical Tool for Better Visualization
Dot plots are a valuable method for recording data in a clear and concise manner. With values displayed along the horizontal axis and frequency represented by the number of dots in each column, dot plots provide a visual representation that aids in understanding data distribution. In this example, the number of raisins counted in boxes from a bulk packet is examined through a dot plot. It is observed that the distribution of data is asymmetrical, with a predominant cluster falling within the range of 63-65 raisins. Additionally, the value 55 appears to be an outlier. This exercise showcases the practical application and interpretation of dot plots for analyzing data patterns and outliers effectively.

Effective Data Recording with Dot Plots: An Analytical Tool for Better Visualization
E N D
Presentation Transcript
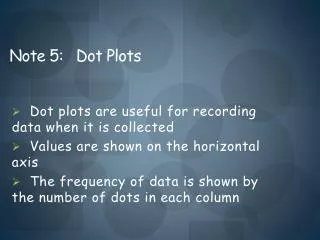
Dot plots are useful for recording data when it is collected Values are shown on the horizontal axis The frequency of data is shown by the number of dots in each column Note 5: Dot Plots
Example: The number of raisins were counted in boxes from a bulk packet of raisins. 64 65 55 64 65 67 61 61 65 64 63 65 65 Draw a dot plot and comment on the distribution of the data The distribution of the data is asymmetrical There is one main cluster of data – number of raisins 63-65 The number of raisings 55 appears to be an outlier
Work Book Page 236 Exercise D