Download
1 / 26
270 likes | 404 Vues
Downloaded from CivilDigital.com. Reaction kinetics and validity of BOD test for domestic wastewater released in marine ecosystems. Submitted to: Prof. A. B. Gupta Deptt. Of Civil Engg. MNIT, Jaipur. Submitted by: T. Sunder rami reedy 2012 PCE 5010 Deptt. Of CE MNIT, Jaipur.

E N D
Downloaded from CivilDigital.com Reaction kinetics and validity of BOD test for domesticwastewater released in marine ecosystems Submitted to: Prof. A. B. Gupta Deptt. Of Civil Engg. MNIT, Jaipur Submitted by: T. Sunder rami reedy 2012 PCE 5010 Deptt. Of CE MNIT, Jaipur
Downloaded from CivilDigital.com CONTENTS : • Introduction. • Materials and methods. • Results and discussion. • Observations. • Summary and conclusions.
Downloaded from CivilDigital.com Introduction : • cities have resulted in faster growth rate. • 17 coastal megacities covering about 25% of the world's population. • The availability of oxygen in the ocean is limited due to high chlorides. • The biochemical degradation rates are slower in salinity water. • BODis a wet oxidation process, which follows first-order kinetics. The values of kinetic rate constants are expected to differ with varying salinities and temperatures. • Research is carried out using glucose–glutamic acid and domestic wastewater to evaluate the impact of salinity on biodegradation of carbonaceous waste at 20°C and 27°C. • Inverse relationship between rate of biodegradation and salinity. • BOD exertion at 20°C (5 days) and 27°C (3 days) for the marine environment is comparable at selected salinities.
Downloaded from CivilDigital.com • Exertion of BOD is: 1. PH ,osmotic conditions,salinity,o2. 2. temp.,time of incubation, seed acclimatization. • “k” ranging from 0.1 to 0.6 per day at 20°C for the domestic wastewaters (Thomann1974). • BOD for “glucose–glutamic acid” showed lower value in seawater than that observed in freshwater. • Finding the of BOD exertion of GGA and domestic wastewater under specific salinities expressed in terms of chloride concentrations at 20°C and 27°C.
Downloaded from CivilDigital.com BOD of glucose–glutamic acid solution exerted with varying chloride concentrations in dilution media at 20°C.
Downloaded from CivilDigital.com • BOD of glucose–glutamic acid solution exerted with varying chloride concentrations in dilution media at 27°C .
Downloaded from CivilDigital.com Comparison of BOD of glucose–glutamic acid solution exerted with varying chloride concentrations at 20°C on the fifth day and 27°C on the third day.
Downloaded from CivilDigital.com Materials and methods : • BOD, which measures oxygen requirement for aerobic stabilization of the organic matter, is a bioassay test. • The natural seawater with 35–36 parts per thousand (ppt) of salinity has about 20,000 mg/L of chlorides. • The experiments were conducted for a 10-day period to achieve maximum exertion of carbonaceous BOD. • A cotton-filtered domestic wastewater was used as "seed” to provide a heterogeneous population of microorganisms. In view of the fact that BOD exerted at 20°C for 5 days is equivalent to the BOD at 27°C for 3 days. • The incubated samples various time slots were analyzed for the existence and adequacy of heterotrophic microorganisms under various chloride concentrations using Zobel/nutrient agar media.
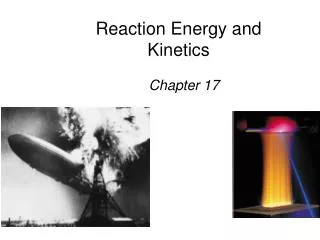
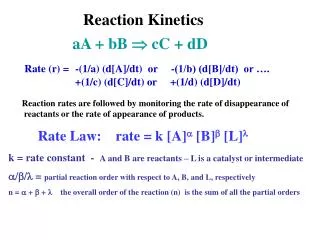
Downloaded from CivilDigital.com Results and discussions : • the decomposition rate of organic contaminants phenomenon occurs due to restriction of osmoregulatory processes responsible for the breakdown of organic compounds within the cells of microorganisms. • According to the first-order equation of chemical kinetics (Sawyer et al.2010), the rate of decomposition is directly proportional to the amount of undecayed material and may be mathematically expressed as = -sign indicates the loss of material with time. = C is the concentration of oxidizable organic matter . at the start of the time interval t. = K is the rate constant. • The BOD curve can be described by a first-order kinetics equation (Metcalf and Eddy, Inc.2003) • dL0/dt = -k L0
Downloaded from CivilDigital.com y = Amount of oxygen consumed (or BOD) at time t t = Time elapsed since the start of the assay L0 = Total amount of oxygen consumed in the reaction (or ultimate BOD) k = Reaction constant • Comparison of BOD of domestic wastewater exerted with varying chloride concentrations in dilution media at 20°C on the fifth day and 27°C on the third day.
Downloaded from CivilDigital.com Average values of “k” at 20°C and 27°C for domestic wastewater. The importance of the reaction rate constant “k” for BOD was realized, and it was felt that “k” values must be known for a particular environmental condition for proper evaluation of ultimate BOD status.
Downloaded from CivilDigital.com The better the linear regression (on the right) fits the data in comparison to the simple average (on the left graph), the closer the value of is to one. The areas of the blue squares represent the squared residuals with respect to the linear regression. The areas of the red squares represent the squared residuals with respect to the average value. • Coefficient of determination (r2), a measure of the proportion of variability in a data set that is accounted for by a statistical model; often called R2; equal in a single-variable linear regression to the square of Pearson's product-moment correlation coefficient. (The strength of the linear relationship between the values). • Correlation coefficient (r) , a broad class of statistical relationships between two or more random variables or observed data values.
Downloaded from CivilDigital.com Values of r 2and r for BOD of glucose–glutamic acid and domestic wastewater under varying concentration of chlorides . • the two variables is the “correlation coefficient” (r). A positive correlation states that increasing values in one variable correspond to increasing values in the other variable, while a negative correlation states that increasing values in one variable correspond to decreasing values in other variables. Values close to 1 indicate excellent linear reliability. • Linear regression gives the relationship between two variables, by fitting the observed data into a linear equation. The square of the correlation coefficient (r²) is a useful value in evaluating linear regression.
Downloaded from CivilDigital.com Observations : • BOD exertion was 10% to 15% higher at 27°C as compared to 20°C for all media. • With incremental increase in chloride concentration, BOD exerted for conventional time and temperature (20°C, 5 day) dropped progressively from 70% to 46% for glucose–glutamic acid solution and from 56% to 31% for domestic wastewater. • The values of BOD exerted at 20°C, 5 days, and 27°C, 3 days. • Sudden rise in BOD exertion was not observed after the sixth or seventh day when oxidation of nitrogenous waste is expected to start. • Adequate microorganisms were present at higher chloride concentrations for the whole test period at both the temperatures. Existence, survival, and multiplication of microbes were not the limiting factors for reducing the trend in BOD exertion at various chloride concentrations. • The “k” values had lowered with increase in chloride concentrations. • Significantly higher values for “k” were observed at 27°C as compared to 20°C indicating faster rate of oxidation at elevated temperature. • The values of the square of the correlation coefficient (r 2) were negative and greater than 0.9 indicating good strength of the negative association between two variables, i.e., degradation rate and chloride concentration. This trend analysis indicates that as the chloride concentration increases, the rate of degradation of organic matter decreases.
Downloaded from CivilDigital.com Summary and conclusions : • Ten percent to 15% higher BOD was observed at 27°C when compared to 20°C for all media. • Negative impact of chlorides on the oxidation of organic matter was observed showing decrease in BOD exertion at higher chloride concentrations. • This observation permits adoption of BOD test at 27°C with shorter duration for saline waters. • Nitrogenous oxidation was not observed at selected test conditions till 10 days. How ever additional oxygen will be required for nitrogenous BOD and needs consideration while designing waste discharges. • Availability of microbes was not the limiting factor for reduction trend in oxidation of organic matter at increased chloride concentrations. • The values of “k” reduced significantly at elevated salinities. • the correlation coefficient values. The values indicate decreasing trend in degradation with increasing salinities.
Downloaded from CivilDigital.com • Those are indicated the necessity for critical consideration of slow degradation rates while planning the disposal options for organic wastes in the marine environment.
Downloaded from CivilDigital.com References : • http://link.springer.com/article/10.1007/s10661-011-2341-y/fulltext.html. • Thom Ann, R. (1974). Systems analysis and water quality management. New York: McGraw Hill. • http://en.wikipedia.org/wiki/Pearson_product-moment_correlation_coefficient. • http://en.wikipedia.org/wiki/Coefficient_of_determination. • OSPAR (2001) OSPAR convention for the protection of marine environment of the North-East Atlantic. Meeting of working group on priority substances (SPS [2] 01/4),ARONA (SECRETARIAT/EC): October 15–19, 2001
Downloaded from CivilDigital.com Comparison of BOD of domestic wastewater exerted with varying chloride concentrations in dilution media at 20°C on the fifth day and 27°C on the third day.
Downloaded from CivilDigital.com Comparison of BOD of glucose–glutamic acid solution exerted with varying chloride concentrations at 20°C on the fifth day and 27°C on the third day . Comparison of BOD of domestic wastewater exerted with varying chloride concentrations in dilution media at 20°C on the fifth day and 27°C on the third day .
Downloaded from CivilDigital.com Percent exertion of BOD for domestic wastewater at various chloride concentrations at 20°C . Percent exertion of BOD for domestic wastewater at various chloride concentrations at 27°C
Downloaded from CivilDigital.com Total colony-forming units of heterotrophic bacteria during different incubation periods at variable chloride concentrations. • All values to be multiplied by a factor of 108
Downloaded from CivilDigital.com Average values of “k” at 20°C and 27°C for domestic wastewater
Downloaded from CivilDigital.com Values of r 2 and r for BOD of glucose–glutamic acid and domestic wastewater under varying concentration of chlorides .
Downloaded from CivilDigital.com BOD exertion and values of coefficient of determination of glucose–glutamic acid at 20°C. BOD exertion and values of coefficient of determination of glucose–glutamic acid at 27°C .
Downloaded from CivilDigital.com Percent exertion of BOD for domestic wastewater at various chloride concentrations at 27°C. BOD exertion and values of coefficient of determination of domestic wastewater at 20°C