
Area-Proportional Venn Diagrams for Clone Overlap in K562 Biological Replicates
This analysis employs area-proportional Venn diagrams to visualize and compare the clone overlap among biological replicates at specific time points in K562 cell line experiments. The diagrams represent the proportions of each sample that intersect with the other two replicates, highlighting the relative similarity among them. Additionally, the percentage of clones shared among all three biological replicates is documented. For those interested in generating such diagrams, the BioVenn web application is available at http://www.cmbi.ru.nl/cdd/biovenn/.

Area-Proportional Venn Diagrams for Clone Overlap in K562 Biological Replicates
E N D
Presentation Transcript
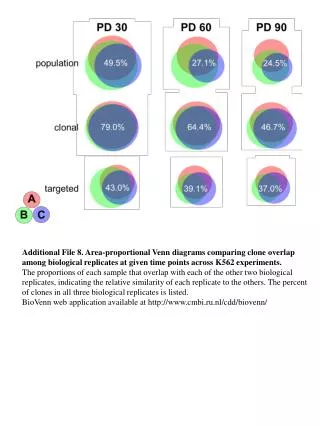
Additional File 8. Area-proportional Venn diagrams comparing clone overlap among biological replicates at given time points across K562 experiments. The proportions of each sample that overlap with each of the other two biological replicates, indicating the relative similarity of each replicate to the others. The percent of clones in all three biological replicates is listed. BioVenn web application available at http://www.cmbi.ru.nl/cdd/biovenn/