Download
1 / 1
10 likes | 192 Vues
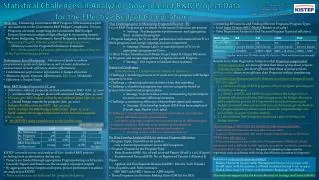
H. Lee*, Y.-J. Kim, H.-K. Lee * hlee@kistep.re.kr [R&D Budget Strategy Division. Objective: Estimating Government R&D Program Efficiencies as a part of our assistants to the Government R&D Budget Compilation Process Programs are units, comprising the Government R&D budget

E N D
H. Lee*, Y.-J. Kim, H.-K. Lee *hlee@kistep.re.kr [R&D Budget Strategy Division • Objective: Estimating Government R&D Program Efficiencies as a part of our assistants to the Government R&D Budget Compilation Process • Programs are units, comprising the Government R&D budget • Korean Government adopted Digital Budget & Accounting System, Top-down Budgeting, Performance Based Budgeting several years ago. • Measuring Program Efficiency assists the budgeting process . • - Efficiency is used in Program Performance Evaluation • - Yr n-1 Performance of a Program affects its Budget Size in Year n+1 in the Top-down budget process. • Our Challenges prior to Measuring Program Efficiency (PE) • 1/3 of R&D Programs get In-depth Performance Evaluation per annum • Strategy : Tracking project performances and aggregating these statistics by program • Program budgeting for Yr n+1 with performance information from Yr n-1 while programs end, merge, regroup, and are reorganized • Strategy: Human Labor to match projects of Yr n-1 to appropriate programs in Yr n+1 • Collect Project Statistics and Obtain Proper Input & Output Measures by Program, and Assign Appropriate Categories for each Program • Strategy: Use Experts to Validate these statistics • Computing Efficiencies and Finding Efficient Programs/Program Types • Used Input Oriented BCC Model (Banker et al, 1984) • Tobit Regression Analysis to find Factors(Program Types) of efficiency Statistical Challenges in Analyzing Government R&D Project Data for the Effective Budget Compilation bipolar: many low PE while many PE close to 1./Note we did not use bimodal • Performance based Budgeting : Allocation of funds to achieve programmatic goals and objectives as well as some indication or measurement of work, efficiency, and/or effectiveness • Links between performance information & budget allocation • Measures: Inputs, Outputs, Effectiveness, Efficiency, Workloads • Efficiency = Output/Input Results from Tobit Regression Analysis is that Programs comprised of bottom-up projects are more efficient than those of top-down projects individual projects are more efficient than those of group projects & Preplanning shows more efficient than Programs without preplanning. • Statistical Challenges : • Data Matching & Classification & Statistical Inferences • Challenge 1: matching projects in Yr 2008-2010 to a program with budget request in Yr 2012 • Challenge 2: obtaining coherent statistics from this matching • Challenge 3: classifying programs into various categories based on project information and program plans • Strategy: Experts reduce errors in measuring inputs/outputs for more accurate efficiency measures • Challenge 4: measuring efficiency with multiple inputs and outputs • Strategy: Data Envelop Analysis (DEA) has been employed (Farrell, 1957; Banker et al, 1984) • Challenge 5: incorporating statistical and systematical uncertainties • - survey data have various uncertainties • - inference on groups of efficiency measures based on different types of outputs, results in different error structures/distributions • (basic research does not produce patents and royalties). • On going workto tackle this statistical challenge Use of Efficiency Measure and Tobit Regression Analysis in Budget Process [We can suggest] […] officers in charge of R&D programs efficient program planning and budgeting strategies […] officers in NSTC and MoSF increase/reduce the budget size of relatively efficient/inefficient R&D programs in the budget allocation and compilation process (A Program with good performance gets budget increment whereas one with poor performance gets deduction) […] program planning schemes and adjust the program budget size accordingly as a part of policy analysis. […] the midterm R&D budget projection as a part of settling new budget systems • Brief R&D Budget Process for FY 2012 • [Ministries submit] proposals on their priorities in R&D (Oct. 31, 2010) • […] midterm R&D program plans with estimated budget (Jan. 31, 2012) • Ministry gets R&D budget ceiling by the midterm plans (Apr. 30, 2012) • […] detail budget requests by program (Jun. 30, 2012). • Budget (Re)Allocation by NSTC (Jul. 31, 2012) • NSTC finalizes the R&D budget deliberation (Sept. 15, 2012) • MoSF submits the budget deliberation to the National Assembly (Oct. 2, 2012) • We (KISTEP) make contributions to these yellow steps 1.1 tr. won ~ $1 mil • Shortcomings of DEA from the statistical inference perspective : • Statistical Uncertainties are not take into account. • Curse of Dimensionality: the more input/output measures, the more DMUs have efficiency 1. • Efficiency measures are results of a Nonparametric Method, valued between 0 and 1, difficult to link regression analysis methods, assuming some distributional properties (In quest of adopting nonparametric regression analysis schemes while using the efficiency measures as response). • On Data Envelop Analysis(DEA) to measure Program Efficiency: • Program Input: Expenditure in 2008-10 • - only coherent input measure across R&D programs • Program Outputs by the Program Type • - Basic Research(BR): No. of well received Papers (R2nIF ≥ 1.0) [=Papers] • - Fundamental Research(FR): No. of Registered Patents [=Patents] & Papers • - Applied and Development Research(ADR) : Patents, Tech Transfer Fees, Royalties, and Sales Increases • - SME R&D aids(SME): Same as ADR outputs • These Programs are Decision Making Units (DMUs) for DEA. • KISTEP currently survey and analyze all Gov. funded R&D projects including their performances during 2011. • Projects are funded through appropriate Programs during each fiscal yr. • Scientific Papers and Patents are the examples of project outputs • By aggregating these outputs and inputs, project performance statistics are analyzed at KISTEP • These statistics are not fully used for program budgeting • References: written in Korean are omitted • Banker, Charnes & Cooper (1984) Management Science vol.30(9) pp. 1078 – • Farrell (1957) with discussions. J. of Royal Statistical Society A vol. 120 pp.11- • Shah & Shen (2007) “A Primer on Performance Budgeting,” World Bank This work was supported by the Korean Ministry of Strategy and Finance(MoSF)