Download
1 / 15
160 likes | 423 Vues
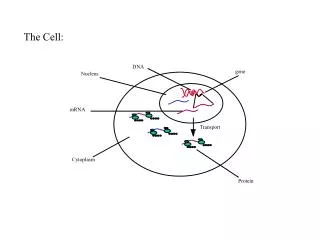
TRANSPORT. Energy Demand Projections. Tom Tapper 24 th February 2005. The Transport Predicament. Transport is essential for the economic prosperity of the UK

E N D
TRANSPORT Energy Demand Projections Tom Tapper 24th February 2005
The Transport Predicament • Transport is essential for the economic prosperity of the UK • Our spatially diffuse society relies on transport to facilitate the high levels of personal mobility and freedom we have come to expect • However, our motorised society has lead to significant increases in energy demand and significant environmental impacts from the inefficient use of energy.
Historical Trends Moving from an Industrial society to a highly mobile, Transport based society
Factors affecting changes in transport energy use • Is estimated that 90% of the change in demand for transport is due to changes in the Output effect (Increasing demand) • While 10% is due to change in the Intensity effect (Changes in Structure and efficiency)
Total Light Vehicle Energy Consumption • On average has increased by 18.6 PJ per annum • Recently energy consumption has reach a plateau and begun to decline • Is this a promising sign for the future? Total UK Light Vehicles • Consistent Increase of approximately 0.46 Million vehicles per annum • No signs to suggest total vehicles will start to decline
How Factors effect energy consumption • To analyse how each individual factor has influence energy consumption, a datum year was chosen (1964), then each factor was held constant as the other factors varied thus showing the individual factors contribution to overall energy consumption • This demonstrates the importance of fuel efficiency in minimising energy consumption, given no improvements in energy efficiency the energy demand would be significantly greater than that today. • The graph also displays that the total number of vehicles on the roads is driving the increases in energy consumption, therefore this is a target area for reductions. • The graph shows that only recently have improvements in fuel efficiency and reductions in Km/Vehicle been significant enough to compensate for the increasing number of vehicles on the roads, thus resulting in the gradual reductions in energy consumption
Despite improvements in efficiency, increase in total vehicles drives demand up Demand decreases as increase in total cars slows and efficiency improves
Energy Scenarios • Worst: Emission controls are implemented but weak and lack enforcement, little is done to change social structure: minor reduction in KM/Vehicle and total cars increase. Summary: energy consumption gradually increases • Best: Emission control is set and implemented quickly, as new, efficient cars flood the market reductions occur more rapidly, by 2030 emissions reduced by 40%. Society is more aware of climate change, and is adjusting accordingly to reduce vehicle ownership per head to Km/vehicle. Summary: Energy Consumption significantly decreases • Likely: Regulations are partially successful, however, accepting that society doesn’t respond as quickly as imagined and some technical difficulties in emission reductions
Projected energy demand, passenger road transport Units: (PJ) These projections are based on road passenger transport, this area consumes the largest proportion of energy within transport sector, over 50%, thus changes in this sector will have the most significant impacts. However, changes in demand from other sectors are currently more variable therefore demand some attention
Total Demand Calculations 1970: 6114 PJ (19% Transport) 2000: 6703 PJ (34% Transport) 2030: 7346 PJ (39% Transport, DTIprojection ) (7346/100)*39 = 2864 PJ Total Transport Demand 2030 Of which Passenger transport will account for 958PJ or 33% Currently Freight Transport = 29% of Total Transport, with a previous growth rate of 17%, freight transport will continue to increase but at a lesser rate, due to advances in efficiency and saturated markets – 17% further growth over 30 year period. Therefore by 2030 Freight Transport will account for 33.9% or 970 PJ Air will follow a similar pattern, at present accounting for 18% of Total Transport growth rate of 73% over 10 years, this increase will continue but at a lesser rate – 73% over 30 years. Therefore by 2030 Aviation will account for 31% or 889 PJ
Overall Transport Energy demand continues to grow to accommodate highly mobile society Increased diversity of transport energy demand, decrease in passenger, significant increase in air and freight
Assumptions • Market processes with naturally improve vehicle efficiency • Growth in Air and Freight transport will reduce but still remain high • Discounting water and rail: insignificant contribution • Carbon trading does not affect transport industry due to mobility of source • Predictions rely on fossil fuels to provide majority of energy, an increased role in small diesel power units, greater reliance on gas imports until hydrogen infrastructure in installed • Large scale investment into a hydrogen technology: creating an infrastructure, developing vehicles and integrating fuel-cells into society as to begin the transfer from an oil to a hydrogen nation