Understanding Categorical and Quantitative Variables in Political Research
This article explores the concepts of categorical and quantitative variables within the context of political phenomena. It discusses examples of each type of variable, such as height and blood alcohol levels, alongside key measures of central tendency. The importance of operationalizing concepts such as political tolerance and the distinction between nominal and ordinal variables are highlighted. Additionally, the article delves into the research question related to the variability of political behaviors and preferences, emphasizing the significance of independent and dependent variables in understanding social dynamics.

Understanding Categorical and Quantitative Variables in Political Research
E N D
Presentation Transcript
What is an example of a categorical variable? • A. Height • B. Blood alcohol level • C. Religion • D. Shark attacks
What is an example of a quantitative variable? • A. Height • B. Blood alcohol level • C. Shark attacks • D. All of the above
What is a good measure of central tendency for categorical variables? • A. mean • B. median • C. mode • D. All of the above
Definition of concepts • A concept is a political phenomenon that varies from low to high • It is unidimensional
Examples of concepts? • Democracy Y • Political tolerance Y • Culture N • Intelligence Y • Interpersonal trust Y • Self esteem Y • Pluralism maybe • Germany NO • Federalism maybe, probably
Units: time, people or places • Units are the observations, which are placed on the unidimensional concept scale according to their low or high values • People are more or less politically tolerant • Countries are more or less democratic • Years have higher or lower rates of crime rates • People are more likely to litigate • Countries can have higher or lower rates of litigation
Variables • Variables are the operationalizations of concepts • As researchers, we develop a systematic scheme for applying numbers to units • When we do this, we have a variable
Examples of variables.What are the possible units? • Murder rate • Litigation rate • Support for freedom of speech • Income • Party identification • Liberalism
What is not a variable? • Speed of light • Parameters • Statistics These are called constants. • Some political phenomena can be concepts and variables for some units but not for others. • September 11th is not a variable with people as the unit.
Political tolerance as a concept • Political tolerance is a concept that indicates how much support people have for the civil liberties and rights of their most hated political group. • It is not racial tolerance. • Notice that to “tolerate” something, you have to, by definition, not like it.
Operationalization of political tolerance If your worst political enemy (i.e. Nazi’s, KKK) came to your town, would you support their right to march downtown? Not support at all Not really support Somewhat support Strongly support 4 1 2 3
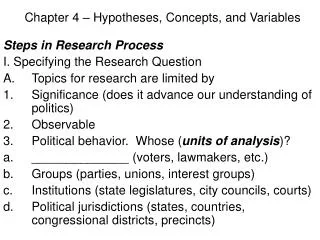
Types of Variables • Ordinal • Dichotomous • Nominal All of these variables can be either • Independent (explanatory) • Dependent (response)
Dependent variable • This is the political or social phenomenon we are interested in explaining. • It should be important. • And its explanation should matter to us. • For the research question, why does y vary, the dependent variable is the y. • There is only ONE dependent variable in any research project.
Independent variables • These are the political or social phenomena we use to explain our dependent variable. • Logic, along with previous literature, can be used to defend why you believe that the independent variables causes the dependent variable. • There should be non-obvious, interesting and important implications from these relationships.
Nominal Variables • With nominal variables, there is no ordinal sense to their measurement • The values are not in order
Examples of nominal measures • Race (White, Black, Asian, other) • Occupation (teacher, manager, worker) • Who is most guilty for causing the terrorist attack? • Hostage takers, Putin, Duma, local government
Cumulative Frequency Percent Valid Percent Percent Valid 1 Hostage takers 169 51.8 51.8 51.8 2 President Putin 20 6.1 6.1 58.0 3 Other federal 43 13.2 13.2 71.2 authorities 5 Moscow city authorities 16 4.9 4.9 76.1 6 FSB 46 14.1 14.1 90.2 7 Militia or GBDD 7 2.1 2.1 92.3 8 Doctors/emergency 3 .9 .9 93.3 services 97 Refused 1 .3 .3 93.6 99 Unsure 21 6.4 6.4 100.0 Total 326 100.0 100.0 Nominal frequency distribution mainguilt Who or what do you think is mainly guilty for causing your problems? syntax freqvars = mainguilt.
The Research Question:Why does ‘y’ vary? • Why do some people vote for Democrats and others for Republicans? • Why do some ethnic conflicts get resolved and other end in holocausts? • Why do some democracies remain stable and others fall apart? • Why are some economies successful and others are not? • Why do some civil conflicts result in revolution and others do not? • What causes some people to support the civil liberties of political enemies? • What causes some people to trust one another and others not to trust? • What causes some people to participate in their government? • What causes some people to bring litigation against their government?
Causal model X Y Independent variable causes dependent variable For example: Percentage of people living in urban areas causes female literacy What could be the units of analysis in this example?
Datarows = unitscolumns = variables Country population Urban% Religion Austria 8000 58 Catholic Belgium 10100 96 Catholic Bosnia 4600 36 Muslim Bulgaria 8900 68 Orthodox Canada 29100 77 Catholic Croatia 4900 51 Catholic Czech Rep. 10400 72 Catholic Denmark 5200 85 Protestant Finland 5100 60 Protestant France 58000 73 Catholic Germany 81200 85 Protestant Iceland 263 91 Protestant
Female literacy and urban density What are the units in this analysis? R code: library(foreign) #Choose the file `wbdata.dta’ myFile <- file.choose() dat <- read.dta(myFile,header=TRUE) attach(dat) #Make Scatterplot scatterplot(femlifeexp~urbanpctoftotal, reg.line=lm, smooth=TRUE, spread=TRUE, boxplots='xy', span=0.5, data=dat) Stata Code: use wbdata.dta twoway (lfitcifemlifeexpurbanpctoftotal) (scatter femlifeexpurbanpctoftotal)