Machine Learning Math Essentials Part 2
Machine Learning Math Essentials Part 2. Gaussian distribution. Most commonly used continuous probability distribution Also known as the normal distribution Two parameters define a Gaussian: Mean location of center Variance 2 width of curve. Gaussian distribution. In one dimension.

Machine Learning Math Essentials Part 2
E N D
Presentation Transcript
Gaussian distribution • Most commonly used continuous probability distribution • Also known as the normal distribution • Two parameters define a Gaussian: • Mean location of center • Variance 2 width of curve
Gaussian distribution • In one dimension
Gaussian distribution • In one dimension Causes pdf to decrease as distance from center increases Controls width of curve Normalizing constant: insures that distribution integrates to 1
Gaussian distribution = 0 2 = 1 = 2 2 = 1 = 0 2 = 5 = -2 2 = 0.3
Multivariate Gaussian distribution • In d dimensions • x and now d-dimensional vectors • gives center of distribution in d-dimensional space • 2 replaced by , the d x d covariance matrix • contains pairwisecovariances of every pair of features • Diagonal elements of are variances 2 of individual features • describes distribution’s shape and spread
Multivariate Gaussian distribution • Covariance • Measures tendency for two variables to deviate from their means in same (or opposite) directions at same time high (positive) covariance no covariance
Multivariate Gaussian distribution In two dimensions
Multivariate Gaussian distribution In two dimensions
Multivariate Gaussian distribution In three dimensions rng( 1 ); mu = [ 2; 1; 1 ]; sigma = [ 0.25 0.30 0.10; 0.30 1.00 0.70; 0.10 0.70 2.00] ; x = randn( 1000, 3 ); x = x * sigma; x = x + repmat( mu', 1000, 1 ); scatter3( x( :, 1 ), x( :, 2 ), x( :, 3 ), '.' );
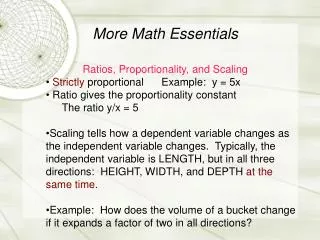
Vector projection • Orthogonal projection of y onto x • Can take place in any space of dimensionality > 2 • Unit vector in direction of x isx / || x || • Length of projection of y indirection of x is || y || cos( ) • Orthogonal projection ofy onto x is the vectorprojx( y ) = x || y || cos( ) / || x || =[ ( x y ) / || x ||2 ] x(using dot product alternate form) y x projx( y )
Linear models • There are many types of linear models in machine learning. • Common in both classification and regression. • A linear model consists of a vector in d-dimensional feature space. • The vector attempts to capture the strongest gradient (rate of change) in the output variable, as seen across all training samples. • Different linear models optimize in different ways. • A point x in feature space is mapped from d dimensions to a scalar (1-dimensional) output z by projection onto :
Linear models • There are many types of linear models in machine learning. • The projection output z is typically transformed to a final predicted output y by some function : • example: for logistic regression, is logistic function • example: for linear regression, ( z ) = z • Models are called linear because they are a linear function of the model vector components 1, …, d. • Key feature of all linear models: no matter what is, a constant value of z is transformed to a constant value of y, so decision boundaries remain linear even after transform.
Geometry of projections w0 w slide thanks to Greg Shakhnarovich (CS195-5, Brown Univ., 2006)
Geometry of projections slide thanks to Greg Shakhnarovich (CS195-5, Brown Univ., 2006)
Geometry of projections slide thanks to Greg Shakhnarovich (CS195-5, Brown Univ., 2006)
Geometry of projections slide thanks to Greg Shakhnarovich (CS195-5, Brown Univ., 2006)
Geometry of projections margin slide thanks to Greg Shakhnarovich (CS195-5, Brown Univ., 2006)
From projection to prediction positive margin class 1 negative margin class 0
Logistic regression in two dimensions Interpreting the model vector of coefficients • From MATLAB: B = [ 13.0460 -1.9024 -0.4047 ] • = B( 1 ), = [ 1 2 ] = B( 2 : 3 ) • , define location and orientationof decision boundary • - is distance of decisionboundary from origin • decision boundary isperpendicular to • magnitude of defines gradientof probabilities between 0 and 1
Logistic function in d dimensions slide thanks to Greg Shakhnarovich (CS195-5, Brown Univ., 2006)
Decision boundary for logistic regression slide thanks to Greg Shakhnarovich (CS195-5, Brown Univ., 2006)