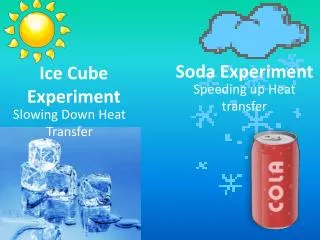
Ice Cube Experiment
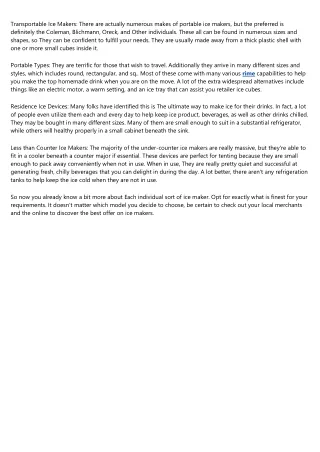
Soda Experiment. Ice Cube Experiment. Speeding up Heat transfer. Slowing Down Heat Transfer. How to use this Powerpoint to help complete your project packet.

Ice Cube Experiment
E N D
Presentation Transcript
Soda Experiment Ice Cube Experiment Speeding up Heat transfer Slowing Down Heat Transfer
How to use this Powerpoint to help complete your project packet • This powerpoint has color-coded information for the two different experiments that we conducted in the standard science classes. RED = Ice Cube Project; BLUE = Soda Project; Green= Both • Use this powerpoint to make corrections to your project packet pages 22-25 • Be sure you are ONLY writing information about the experiment that you conducted (or signed up for) in class. • Ice Cube Project: If you signed up for the ice cube project, read everything written in red and make corrections in your packet • Soda Project: If you signed up for the soda project, read everything written in blue and make corrections in your packet • BOTH PROJECTS – anything written in green is information for BOTH projects. • HOMEWORK – Due Fri 1/31 – pgs 26-30; Due Mon 2/3 pgs 31-34
Key Red – Ice cube experiment info. Blue – Soda experiment info Green – applies to both projects Pg 22 Ice- What affect do different types of insulation have on preventing an ice cube from melting? Soda: What effect do different chilling methods have on the temperature of a soda after 10 minutes? ICE - If different types of insulation are used, then the ice cube container insulated with (write your choice here) will melt the LEAST in 10 minutes. Soda - If different methods of chilling are used, then the soda placed in the (write your choice here) will be coldest after 10 minutes. Answer on next page
Pg 22 Answer here: GIVE A REASON WHY: Your answer must scientifically explain why your hypothesis may be right by explaining how heat transfer works, how each type of insulation / chilling methods works, and why the method you selected with be most effective. Use your BIG words /SCIENCE words! (Do not use he, she, IT, they, or we.) Use the ACE strategy in ALL of your answers. A- rephrase the question as a statement and answer the question; C- cite evidence from research, or notes; E- Ellaborate with definitions, examples, and details
Test Subject: Ice Cubes Soda Pg 22 ICE: Type of insulation used / Soda: Method of Chilling NO insulation Styrofoam Cotton Bubble wrap Refrigerator Bucket of ice Ice & salt Dry Ice
Key Red – Ice cube experiment info. Blue – Soda experiment info Green – applies to both projects Pg 23 Test Subject. = ice cube / sodaI.V. = type of insulation used / method of chilling D.V. = Volume of ice melted in 10 minutes / Temperature of soda after 10 min Volume of liquid water after 10 minutes (mL) (Think: What materials are needed to measure liquid volume? Graduated cylinders) Temperature of soda after 10 min. (what equipment will you need? Thermometers) Cracking ice, condensation, feel cold, melting ice/water Fizzing / bubbles Ice– type, amount Box to hold ice - size/volume Environment – room temp, tables, Time tested (10 minutes) amount of sun and heat as well as distance from ice Soda– type, amount, cup (size, type)
Key Red – Ice cube experiment info. Blue – Soda experiment info Green – applies to both projects Materials Pg 23 12 12 Dress for lab safety - closed-toed shoes, hair up, no long sleeves or jewelry
Pg 24 At LAJH – 2851 Sandridge Rd., Green Cove Springs, FL 32043 Dress for lab safety - closed-toe shoes, hair pulled up, no loose dangly jewelry or clothes. Caution with heat lamps – never leave unattended Caution with sharp objects - use scissors carefully and cut away from you Caution – use gloves or tongs when handling dry ice, do not touch with bare skin the temperature of dry ice (frozen CO2 is -109.3F or -78.5C)
See the next few slides for the procedures for your experiment. Be sure you copy, or print then glue, the procedures on page 25 for the experiment you signed up for. The Topics are listed on the top of the slides.
Pg 24-25 Step K: Experiment procedures – ICE Cube • Gather Materials (see material list – thermometers, gr. Cylinders, heat lamps and ring stands…) • Set up “sun” – ring stand on table, clamp heat lamp 30cm above table, plug into extension cord and into wall socket • Create insulating wraps for 12 mini ice chests (wrap 3 each in cotton, styrofoam, bubble wrap, and plain aluminum foil). Be sure you can open and close the lid without removing the wrap. • Take temperature of room and record in notes • Fill each mini ice chest with crushed ice, and place in groups under heat lamp by label of material used. • Turn on heat lamp and START TIMER • Photograph experiment groups as set up for testing • Record qualitative observations: things you see, hear, feel about the experiment: do you see leaking, see condensation, problems that occur during the experiment, etc. • At the end of ten minutes, open mini ice chest, and pour any liquid (melted ice) into a graduated cylinder or test tube to measure the volume of melted ice. • Record volume of melted ice from each trial (mini ice chest) in the table under the correct type of insulation method used.
Pg 24-25 Step K: ICE cube- Experiment procedures • Materials managers clean up according to teacher directions • Calculate the average volume of ice melted by adding all the results for the repeated trials in the control group (aluminum foil only) and dividing by 3. • Repeat step 12 for the styrofoam group, the bubble wrap group, and the cotton group and record results in the data table. • All students must share results with each other and record all data in his/her own folder. • HOMEWORK DUE 1/31– complete project packet pages 26-30 (and revise 22-25 if needed) Compare the results from each test group, graph the final averages, and determine which test group melted the least in the 10 minutes. • HOMEWORK Due 2/3– Research your project variables (ice, insulation: styrofoam, bubblewrap, cotton, aluminum foil, radiation,methods of chilling: refrigeration, ice, salted ice, dry ice, and soda) and Draw conclusions – complete project packet pages (31-32) using what you have learned in science class about heat transfer, changing states of matter, and thermal energy, explain how heat transfer took place in your experiment. Based on your research and your experiment results, INFER a scientific reason that explains how and why you got these results in your experiment? (Was there something different about the types of insulation or chilling methods that caused a change in heat transfer compared to the other test groups, why, etc)
Pg 24-25 Step K: Experiment procedures – Soda • Gather Materials (see material list – thermometers, dishpans, cups, soda, etc…) • Set up 2 dishpans with 4 L of ice each. • Add 225mL of salt to one of the dishpans with ice (label pans) • Set up the third dishpan with about 2 pounds dry ice (broken into smaller chunks) • Pour 200mL soda into 12 plastic cups • Place 3 cups of soda each into each of the 3 dishpans, and place the remaining 3 cups of soda into the refrigerator. • START TIMER • Create labels for each table and Photograph experiment groups as set up for testing • Record qualitative observations: things you see, hear, feel about the experiment: do you see leaking, see condensation, problems that occur during the experiment, etc. • At the end of ten minutes, take the temperatures of the cups of soda for the refrigerator group, record data in table, and share data with your classmates • Repeat step 10 for the ice, ice with salt, and dry ice experimental groups and calculate the average temperature of each, record data in table, and share data with your classmates.
Pg 24-25 Step K: ICE - Experiment procedures - Soda • Materials managers clean up according to teacher directions • Calculate the average temperatures by adding all the results for the repeated trials in the control group and dividing by 3. • Repeat step 13 for the ice, ice and salt, and dry ice experimental groups record results in the data table. • All students must share results with each other and record all data in his/her own folder. • HOMEWORK DUE 1/31– complete project packet pages ( 28-30) Compare the results from each test group, graph the final averages, and determine which test group melted the least in the 10 minutes. • HOMEWORK Due 2/3– Research your project variables (ice, insulation: styrofoam, bubblewrap, aluminum foil, radiation,methods of chilling: refrigeration, ice, salted ice, dry ice, and soda) and Draw conclusions – complete project packet pages (31-34) using what you have learned in science class about heat transfer, changing states of matter, and thermal energy, explain how heat transfer took place in your experiment. Based on your research and your experiment results, INFER a scientific reason that explains how and why you got these results in your experiment? (Was there something different about the types of insulation or chilling methods that caused a change in heat transfer compared to the other test groups, why, etc)
Key Red – Ice cube experiment info. Blue – Soda experiment info Green – applies to both projects See next slide for an example data table for the experiment that you signed up for. Calculate the average for each test group (find the “mean”) Ice Cube experiment = BAR GRAPH! Soda Experiment = Line Graph! X – axis – (independent variable): type of insulation / method of chilling Y-axis – (dependent variable): average volume melted in 10 minutes / temperature
Pg 26 Quantitative Data Ice Cube Experiment Sample Data Table All groups were wrapped in aluminum foil to hold the insulation in place. You were given this table in class 1/29 and were required to glue it in your project packet on page 26. Your data from the experiment must be recorded and averaged for each group tested
Pg 26 Quantitative Data Soda Experiment Sample Data Table You were given this table in class 1/29 and were required to glue it in your project packet on page 26. Your data from the experiment must be recorded and averaged for each group tested
Pg 27 QUALITATIVE Data Ice Cube Experiment Sample Data Table You were you were instructed to write notes on this page during the experiment on 1/29 – Changes in the test subject that you could see, hear, smell, or feel, as well as well as any mistakes or problems that occurred during the experiment.
Pg 27 Quantitative Data Soda Experiment Sample Data Table You were you were instructed to write notes on this page during the experiment on 1/29 – Changes in the test subject that you could see, hear, smell, or feel, as well as well as any mistakes or problems that occurred during the experiment.
Pg 28 This page provides the directions that explain HOW to MAKE and EXCELLENT GRAPH. The next two slides are examples of the proper way to set up your graphs. It is your job to actually graph the data from your experiment.
Pg 29 Ice Cube Experiment Sample: This is how to set up your bar graph. You must graph the results of the averages from your experiment Click the link below if you want to create your graph with a computer program Create a Graph
Pg 29 Soda Experiment Sample: This is how to set up your Quadruple line graph. You must graph the results of the averages from your experiment Click the link below if you want to create your graph with a computer program Create a Graph
Pg 30 Answer these Answer here – refer to A, B, C, & D above and answer each one
Pg 31 Answer hint – copy from page 22 of project packet exactly as stated Answer hint– copy from page 22 of project packet exactly as stated Answer hint: Refer to your graphed data on page 29 and Report the average results in each test group. You Must use the ACE strategy when answering #3-5 on pg 31 and #1-4 pg 32 A = Answer starts by rephrasing the question as a statement C= Cite evidence from experiment and research E - Elaborate = using examples
Pg 31 You Must use the ACE strategy when answering these questions. Answer hints: Yes, my hypothesis stated___ and the results showed ___ No, my hypothesis was not supported. I thought ___ would happen, and the results showed ___ happened. • Answer hints: tell why or how your experimental groups had different results from your control group and from each other. Example… • Your job is to explain if and how heat transferred differently in each test group: were the amounts of heat transferred by radiation, conduction, and convection different in each group, if yes, why, if not, why not! • Explain how differences in heat transfer caused the different groups to melt different amounts during the test./ cool to different temperatures • If your groups responded about the same (very little difference in results), Explain WHY! • you should use a formula like % change or percent error to explain that the differences in heat transfer are so minimal that the difference in melting time is not significant enough to make a person want to change which cone they used. • Or, you need to decide if the results could have been caused by mistakes in measuring or conducting the experiment, and the experiment should be re-tested to be certain.
Pg 32 Answer hints: You must report on every test group! Was the equipment working properly? Were the scientists carefully measuring to get accurate results or were mistakes made, were procedures skipped and done incorrectly in the experiment? Were there some differences between the test groups that made the test unfair? What were they and how do you think it affected the outcome of the experiment? Answer hints: Explain how to fix the problems you reported in #6 in order to make this experiment work better and be more accurate. How to make the experiment a more “FAIR” test / controlled experiment so that the only difference in the test groups is the independent variable. Do NOT tell me what other test groups / subjects could be tested! You Must use the ACE strategy when all of these questions!
Pg 32 Discussion and Conclusions cont’d Answer hints Here is where you can tell me what other experiments you can do with insulation /soda, ice, dry ice, or heat transfer, or how to do a more detailed experiment with the same topic. Answer hints Tell me about companies, consumers, etc. that make, buy, sell, or work with things involving heat transfer , soda/insulation, and how the results of the class experiment can be used to improve their products, or make it last longer, work better, etc. You Must use the ACE strategy when answering pg 32