Download
1 / 157
1.72k likes | 2.33k Vues
Bond Investment Strategies. Types of Bond Strategies. Active Strategies Passive Strategies Hybrid Strategies. Types of Bond Strategies. Active Strategies : Strategies that involve taking active bond positions with the primary objective of obtaining an abnormal return.

E N D
Bond Investment Strategies www.pptmart.com
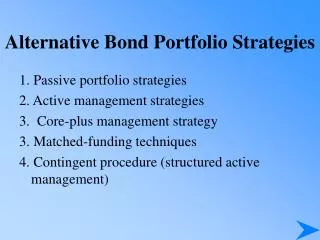
Types of Bond Strategies Active Strategies Passive Strategies Hybrid Strategies www.pptmart.com
Types of Bond Strategies Active Strategies: Strategies that involve taking active bond positions with the primary objective of obtaining an abnormal return. Active strategies are typically speculative. Types: Interest Rate Anticipation Strategies Credit Strategies Fundamental Valuation Strategies www.pptmart.com
Types of Bond Strategies Passive Strategies: Strategies in which no change in the position is necessary once the bonds are selected. Types: Indexing Cash-Flow Matching Classical Immunization www.pptmart.com
Types of Bond Strategies Hybrid Strategies: Strategies that have both active and passive features. Immunization with Rebalancing Contingent Immunization www.pptmart.com
Active: Interest Rate Anticipation Strategies • Types of Interest-Rate Anticipation Strategies: • Rate-Anticipation Strategies • Strategies Based on Yield Curve Shifts www.pptmart.com
Rate-Anticipation Strategies • Rate-Anticipation Strategies are active strategies of selecting bonds or bond portfolios with specific durations based on interest rate expectations. • Rate-Anticipation Swap is a rate-anticipation strategy that involves simultaneously selling and buying bonds with different durations. www.pptmart.com
Rate-Anticipation Swap • Rate-Anticipation Swap for bond portfolio manager when interest rates are expected to decrease across all maturities • Strategy: Lengthening the portfolio’s duration: Manager could sell her lower duration bonds and buy higher duration ones. • By doing this, the portfolio’s value would be more sensitive to interest rate changes and as a result would subject the manager to a higher return-risk position, providing greater upside gains in value if rates decrease but also greater losses in value if rates decrease. www.pptmart.com
Rate-Anticipation Swap • Rate-Anticipation Swap for bond portfolio manager when interest rates are expected to increase across all maturities • Strategy: Shorten the portfolio’s duration: Manager could sell her higher duration bonds and buy lower duration ones. • Defensive Strategy: Objective is to preserve the value of a bond fund. www.pptmart.com
Rate-Anticipation Swap: Cushion Bond • One way to shorten the fund’s duration is for the manager to sell high-duration bonds (possibly option-free) and then buy cushion bonds. • A cushion bond is a callable bond with a coupon that is above the current market rate. www.pptmart.com
Rate-Anticipation Swap: Cushion Bond • Cushion bond has the following features: • High coupon yield • With its embedded call option, a market price that is lower than a comparable noncallable bond. • Note: The interest rate swap of option-free bonds for cushion bonds provides some value preservation. www.pptmart.com
Rate-Anticipation Swap: Cushion Bond Example: • Suppose a bond manager had a fund consisting of 10-year, 10% option-free bonds valued at 113.42 per $100 par to yield 8% and there were comparable 10-year, 12% coupon bonds callable at 110 that were trading in the market at a price close to their call price. • If the manager expected rates to increase, he could cushion the negative price impact on the fund’s value by: • Selling option-free bonds • Buying higher coupon, callable bonds – cushion bonds www.pptmart.com
Rate-Anticipation Swap: Cushion Bond Example: • The swap of existing bonds for the cushion bonds provides: • An immediate gain in income 113.42-110 = 3.42 • A higher coupon income in the future: 12% instead of 10% www.pptmart.com
Rate-Anticipation Swap: Cushion Bond Note • A callable bond has a lower duration than a noncallable one with the same maturity and coupon rate. • The 10-year cushion bond with it call feature and higher coupon rate has a relatively lower duration than the 10-year option-free bond. • Thus, the swap of cushion bonds for option-free bonds in this example represents a switch of longer duration bonds for shorter ones – a rate-anticipation swap. www.pptmart.com
Yield Curve Shifts and Strategies • Yield Curve Strategies:Some rate-anticipation strategies are based on forecasting the type of yield curve shift and then implementing an appropriate strategy to profit from the forecast. www.pptmart.com
Yield Curve Shifts and Strategies Yield Curve Shifts: • Three types of yield curve shifts occur with some regularity: • Parallel Shifts • Shifts with Twists • Shifts with Humpedness www.pptmart.com
Yield Curve Shifts: Parallel • Parallel Shifts: Rates on all maturities change by the same number of basis points. www.pptmart.com
Yield Curve Shifts: Twist • Shifts with a Twist: A twist is a non-parallel shift, with either a flattening or steepening of the yield curve. • Flattening: The spread between long-term and short-term rates decreases. • Steepening: The spread between long-term and short-term rates increases. www.pptmart.com
Yield Curve Shifts: Twist • Shifts with a Twist: • Flattening: • Steepening: www.pptmart.com
Yield Curve Shifts: Humpedness • Shifts with Humpedness: A shift with humpedness is a non-parallel shift in which short-term and long-term rates change by greater magnitudes than intermediate rates. • Positive Butterfly: There is an increase in both short and long-term rates relative to intermediate rates. • Negative Butterfly: There is a decrease in both short and long-term rates relative to intermediate rates. www.pptmart.com
Yield Curve Shifts: Humpedness • Positive Butterfly: ST and LT rates change more than intermediate: • Negative Butterfly: Intermediate rates change more than ST and LT: www.pptmart.com
Yield Curve Shift Strategies • Yield Curve Strategies • The bullet strategy is formed by constructing a portfolio concentrated in one maturity area. • The barbell strategy is formed with investments concentrated in both short-term and long-term bonds. • The ladder strategy is formed with equally allocated investments in each maturity group. www.pptmart.com
Yield Curve Strategies Yield Curve Strategies: • Bullet Strategy: • Barbell Strategy: • Ladder Strategy: www.pptmart.com
Yield Curve Shift Strategies • Strategies Based on Expectations Bullet strategy could be formed based on an expectation of a downward shift in the yield curve with a twist such that long-term rates were expected to decrease more than short-term. If investors expected a simple downward parallel shift in the yield curve, a bullet strategy with longer duration bonds would yield greater returns than an investment strategy in intermediate or short-term bonds if the expectation turns out to be correct. The barbell strategy could be profitable for an investor who is forecasting an upward negative butterfly yield curve shift. www.pptmart.com
Yield Curve Strategies:Total Return Analysis • The correct yield curve strategy depends on the forecast. • One approach to use in identifying the appropriate strategy is Total Return Analysis. • Total Return Analysis involves determining the possible returns from different yield curve strategies given different yield curve shifts. www.pptmart.com
Total Return Analysis • Total Return Analysis Example (Ch. 8, Problem 3): • Consider three bonds: • Assume yield curve is currently flat at 6%. • Consider two strategies: 1. Barbell: Invest 50% in A and 50% in C. 2. Bullet: 100% in Bond B www.pptmart.com
Total Return Analysis • Consider two types of yield curve shifts one year later: • Parallel shifts ranging between -200 BP and + 200 BP. • Yield curve shifts characterized by a flattening where for each change in Bond B (intermediate bond), Bond A increases 25 BP more and Bond C decreases by 25 BP less: ∆yA = ∆yB + 25BP and ∆yC = ∆yB - 25BP www.pptmart.com
Total Return Analysis: Parallel Shifts Bond Return = (Value-100) + 6 Bullet Return = .5(Bond Return for A) + .5(Bond Return for C) Note: The bullet portfolio has a duration of 8.31 (= (.5)(4.46) + (.5)(12.16)). This is approximately the same as the duration of Bond B. www.pptmart.com
Total Return Analysis: Parallel Shifts • Observations: • For different parallel shifts in the yield curve, there is not much difference in the returns on the bullet portfolio and the barbell. This is due to both having the same duration. • If one were expecting a significant downward shift in the yield curve, Bond C with the largest duration would give you the greatest gains. • If one were expecting a significant upward shift in the yield curve, Bond A with the lowest duration would give you the minimum loss. • Comment: The returns are consistent with duration as a measure of a bond’s price sensitivity to interest rate changes. www.pptmart.com
Total Return Analysis:Yield Curve Shifts Characterized by a Flattening ∆yA = ∆yB + 25BP and ∆yC = ∆yB - 25BP www.pptmart.com
Total Return Analysis:Yield Curve Shifts Characterized by a Flattening • Observation: In contrast to parallel shifts, there are differences between the barbell and bullet portfolios when the yield curve shift has a twist, even though they have the same durations. www.pptmart.com
Active Credit Strategies • Two active credit investment strategies of note are quality swaps and credit analysis strategies: A quality swap is a strategy of moving from one quality group to another in anticipation of a change in economic conditions. A credit analysis strategy involves a credit analysis of corporate, municipal, or foreign bonds in order to identify potential changes in default risk. This information is then used to identify bonds to include or exclude in a bond portfolio or bond investment strategy. www.pptmart.com
Quality Swaps • Quality Swap: Strategy of going long and short in bonds with high or low quality rating based on the expectation of a change in economic states. • Strategy: www.pptmart.com
Quality Swaps • Quality swaps often involve a sector rotation in which more funds are allocated to a specific quality sector in anticipation of a price change. Example • Suppose a bond fund manager expected a recession accompanied by a flight to safety in which the demand for higher quality bonds would increase and the demand for lower quality ones would decrease. • To profit from this expectation, the manager could change the allocation of her bond fund by selling some of her low quality ones and buying more high quality bonds. www.pptmart.com
Quality Swaps • Quality swaps can also be constructed to profit from anticipated changes in yield spreads between quality sectors. If the economy were at the trough of a recession and was expected to grow in the future, speculators or a hedge fund might anticipate a narrowing in the spread between lower and higher quality bonds. To exploit this, they could form a quality swap by taking a long position in lower quality bonds and a short position in higher quality bonds with similar durations. Whether rates increase or decrease, speculators would still profit from these positions, provided the quality spread narrows. www.pptmart.com
Quality Swaps www.pptmart.com
Credit Analysis Strategy • The objective of a credit analysis strategy is to determine expected changes in default risk. www.pptmart.com
Credit Analysis • Over the last two decades, the spread between low investment-grade bonds and Treasuries has ranged from 150 basis points (BP) to over 1,000 BP. • At the same time, though, the default risk on such bonds has been relatively high. www.pptmart.com
Credit Analysis: Douglass and Lucas Study • In their empirical study of bonds, Douglass and Lucas found: • For B-rated bonds, the 5-year cumulative default rate was approximately 24% and the 10-year cumulative default rate was approximately 36%. • For CCC-rated bonds, the 5-year cumulative default rates was approximately 46% and the 10-year cumulative default rate was 57%. • In contrast, Douglass and Lucas found: • The 5-year and 10-year cumulative default rates for A-rated bonds were only .53% and .98% and for BBB-rated, the rates were 2.4% and 3.67%. www.pptmart.com
Credit Analysis:Douglass and Lucas Study • The Douglass and Lucas study, as well as several other studies on cumulative default rates, shows there is high degree of default risk associated with low-quality bonds. • The study also suggests, though, that with astute credit analysis there are significant gains possible by being able to forecast upgrades and significant losses that can avoided by projecting downgrades. www.pptmart.com
Credit Analysis Strategy The strategy of many managers of high-yield bond funds is to develop effective credit analysis models so that they can identify bonds with high yields and high probabilities of upgrades to include in their portfolios, as well as identify bonds with high probabilities of downgrades to exclude from their fund. Credit analysis can be done through basic fundamental analysis of the bond issuer and the indenture and with statistical-based models, such as a multiple discriminant model. www.pptmart.com
Fundamental Credit Analysis • Many large institutional investors and banks have their own credit analysis departments to evaluate bond issues in order to determine the abilities of companies, municipalities, and foreign issuers to meet their contractual obligations, as well as to determine the possibility of changes in a bond’s quality ratings and therefore a change in its price. www.pptmart.com
Fundamental Credit Analysis:Corporate Issues • Industrial Analysis: Assessment of the growth rate of the industry, stage of industrial development, cyclically of the industry, degree of competition, industry and company trends, government regulations and labor costs and issues. www.pptmart.com
Fundamental Credit Analysis:Corporate Issues 2. Fundamental Analysis: Comparison of the company’s financial ratios with other firms in the industry and with the averages for bonds based on their quality ratings. • Ratios often used for analysis include: (1) interest coverage (EBIT/Interest), (2) leverage (long-term debt/total assets), and (3) cash flow (net income + depreciation + amortization + depletion + deferred taxes) as a proportion of total debt (cash flow/debt), and (4) return on equity. www.pptmart.com
Fundamental Credit Analysis:Corporate Issues 3. Asset and Liability Analysis: Determination of the market values of assets and liabilities, age and condition of plants, working capital, intangible assets and liabilities, and foreign currency exposure. 4. Indenture Analysis: Analysis of protective covenants, including a comparison of covenants with the industry norms. www.pptmart.com
Fundamental Credit Analysis:Corporate Issues FINANCIAL RATIOS (%) BY RATING CLASSIFICATIONS Source: Standard and Poor’s, Global Sector Review, 1995. www.pptmart.com
Fundamental Credit Analysis:Municipal Issues • Debt burden: This analysis involves assessing the total debt burden of the municipal issuer. • For GOs, debt burden should include determining the total debt outstanding, including moral obligation bonds, leases, and unfunded pension liabilities. • For revenue bonds, debt burden should also focuses on relevant coverage ratios relating the debt on the revenue bond to user charges, earmarked revenue, lease rental, and the like. www.pptmart.com
Fundamental Credit Analysis:Municipal Issues 2. Fiscal Soundness: The objective of this analysis is to determine the issuer’s ability to meet obligations. • For example, for GOs, the areas of inquiry can include: What are the primary sources of revenue? Is the issuer dependent on any one particular source of revenue? • For revenue bonds, relevant questions relate to the soundness of the project or operation being financed. www.pptmart.com
Fundamental Credit Analysis:Municipal Issues 3. Overall Economic Climate: General economic analysis includes: • Examining fundamentals such as growth rates for income, population, and property values. • Determining the status of the largest property values and employers. www.pptmart.com
Fundamental Credit Analysis:Municipal Issues 4. Red Flags: Some of the negative indicators suggesting greater credit risk are: • Decreases in population • Unemployment increases • Decreased in the number of building permits • Declines in property values • Loss of large employers • Use of debt reserves and declines in debt coverage ratios • For revenue bonds, additional red flags could include • Cost overruns on projects • Schedule delays • Frequent rate or rental increases www.pptmart.com